
Restaurant analytics software: How to choose the right platform

In this article
- What restaurant analytics software does
- Key features to look for in restaurant analytics software
- Types of restaurant analytics tools & platforms
- How to choose the right restaurant analytics software
- Best restaurant analytics software compared
- Tenzo's restaurant analytics software
- Conclusion
- Most asked questions

Want to learn more?
Want to see Tenzo's restaurant analytics software in action for yourself?
Let's chatRestaurant analytics software connects your POS, labour, inventory, reservations and reviews into one real-time view, so operators can act on trends daily instead of waiting for month-end reports. The right platform depends on your integrations, scalability, and how well it turns data into decisions your GMs and head office can actually use. Choosing a platform involves knowing what ‘useful’ means to you, understanding what type of system you need for your business and then evaluating pricing.
If you’re evaluating restaurant analytics software, you’ve probably already lived the problem it solves: three different systems, three different login screens, and a spreadsheet stitching it all together by the time anyone gets to look at it. By the time last week’s numbers are compiled, the week is already over and whatever went wrong on Tuesday lunch has already happened again.
This guide covers what to look for in a platform, the different types of tools on the market, how pricing typically works, and what separates a genuinely useful system from one that just adds another dashboard to check.
What restaurant analytics software does
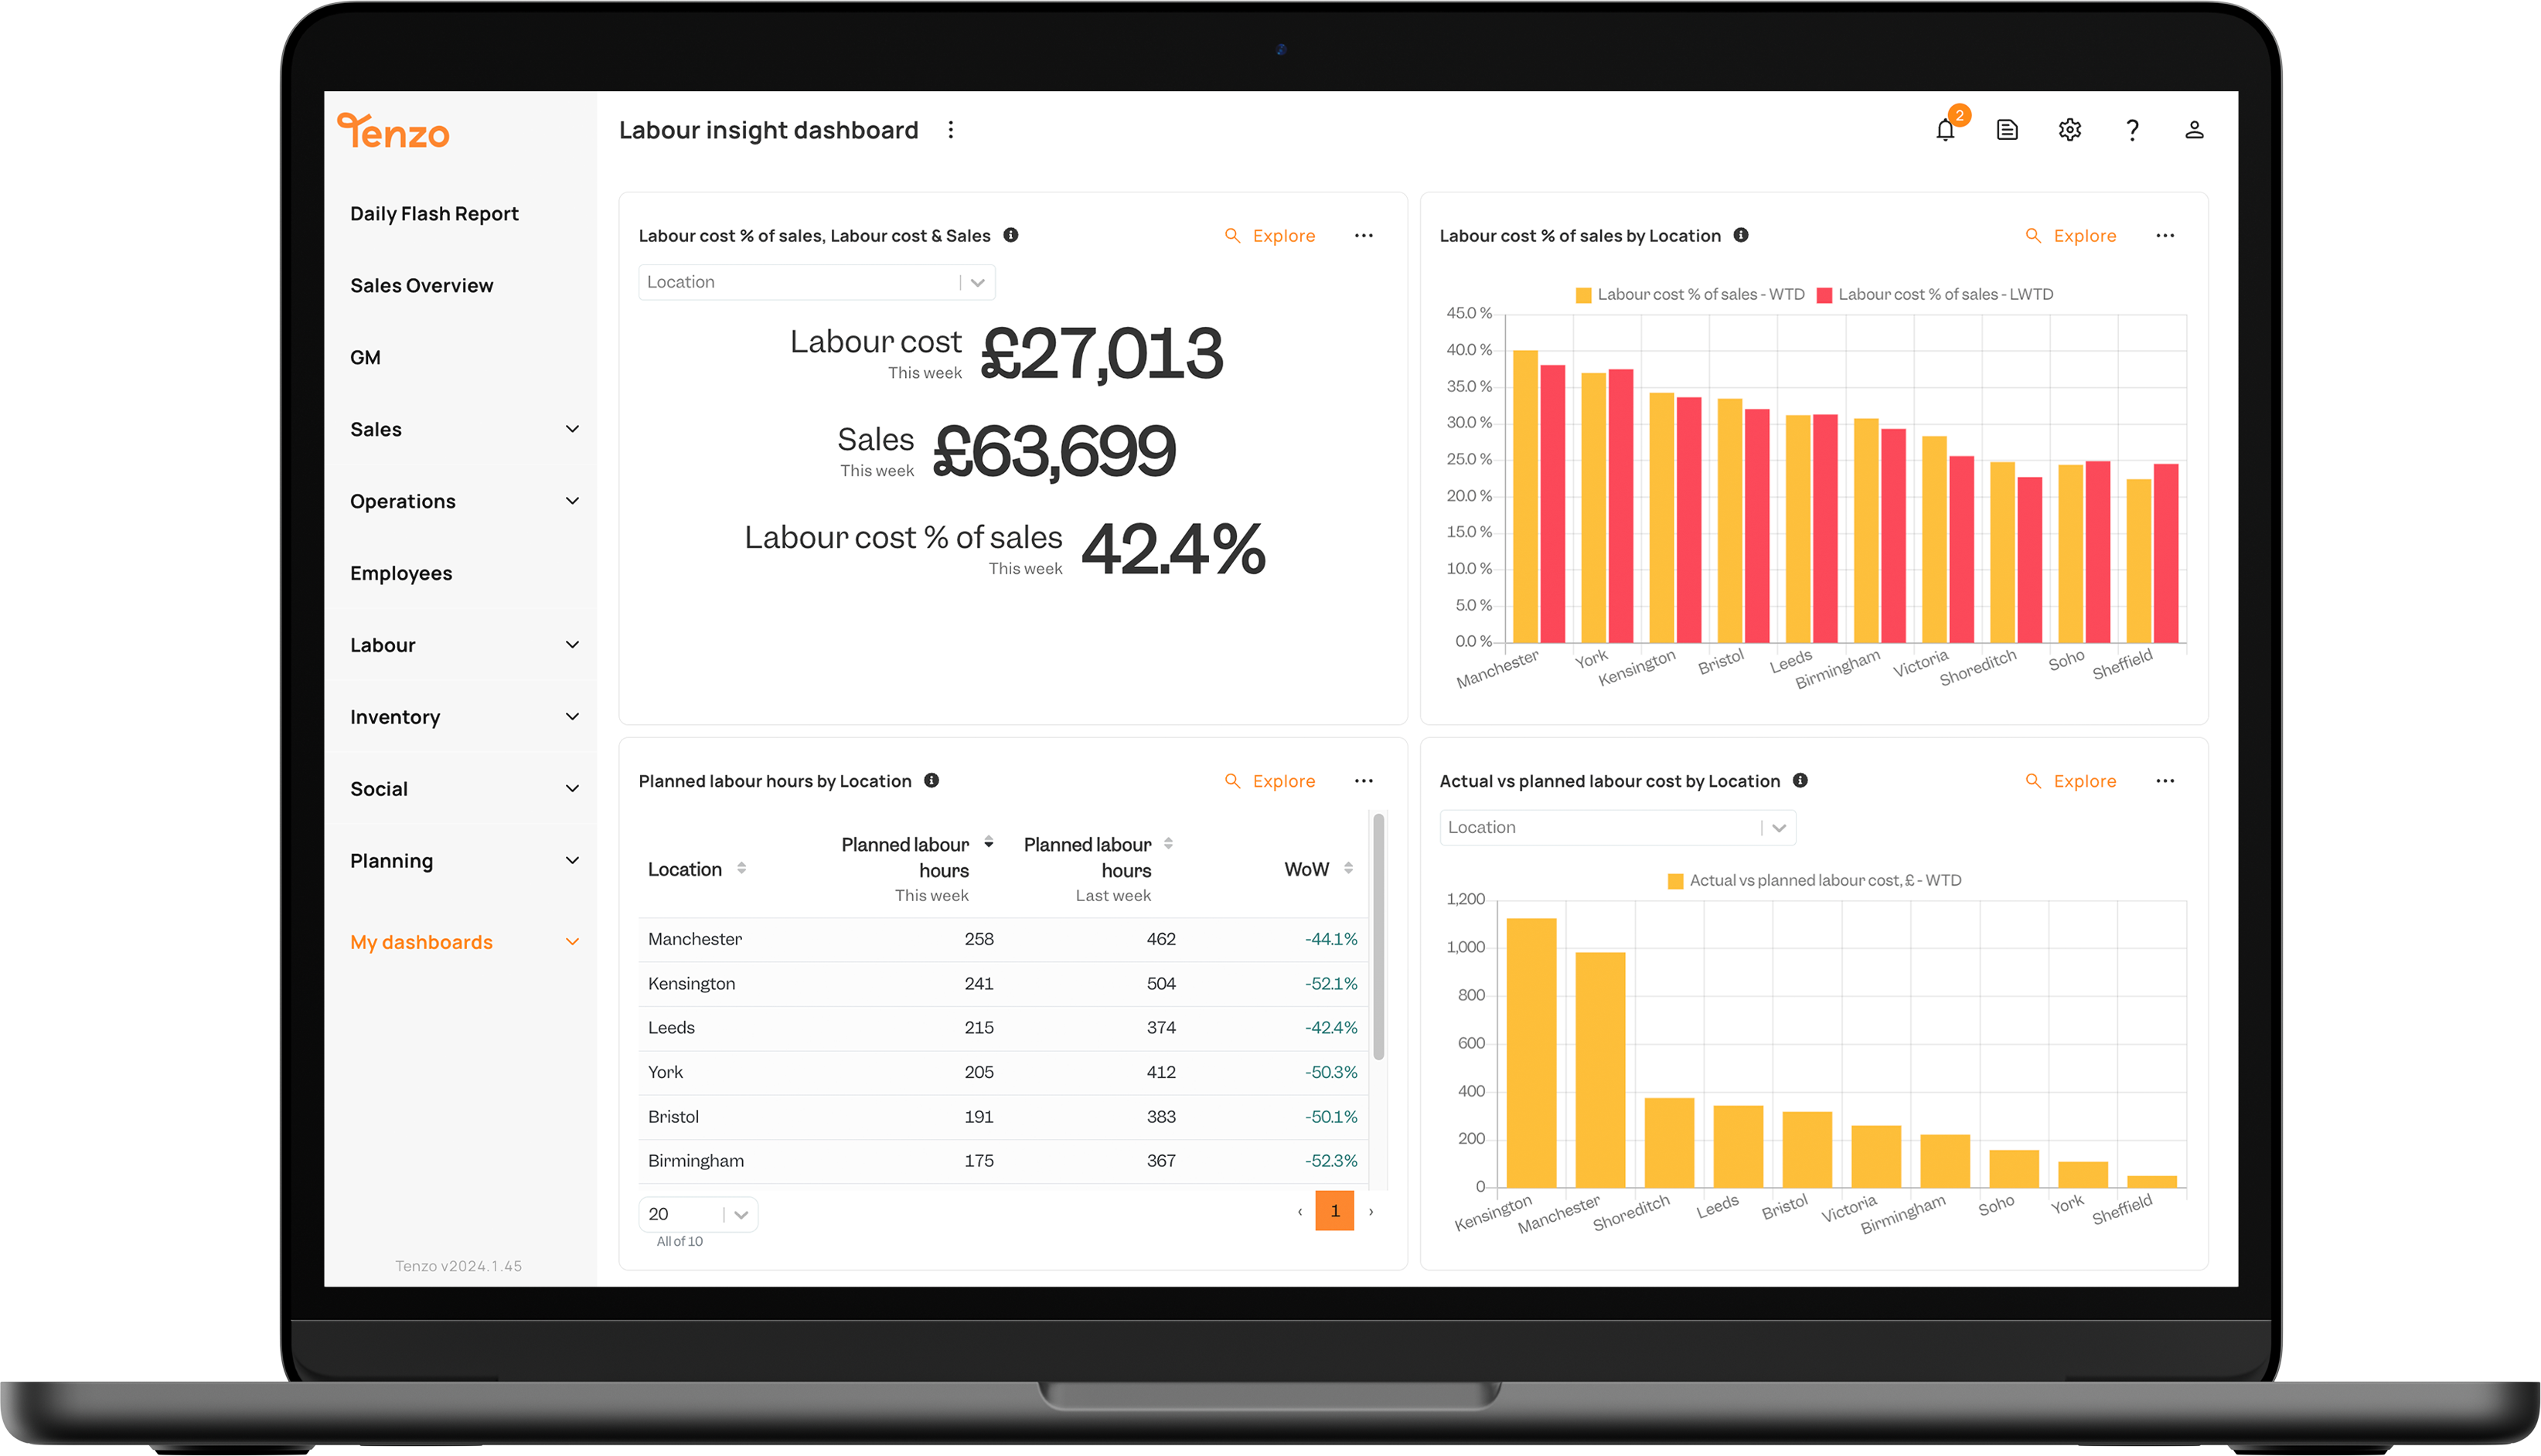
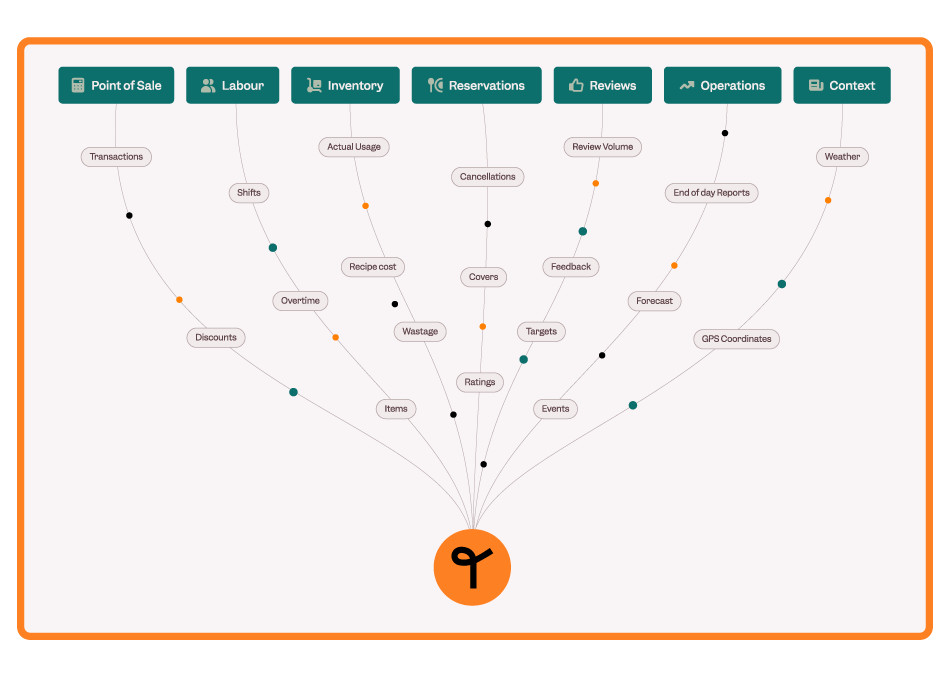
At its core, restaurant analytics software pulls data from the systems you already use – POS, labour, inventory, reservations, reviews – and turns it into a single, real-time view of how your business is actually performing. Instead of pulling reports from multiple different logins and reconciling them by hand, you get one place to look.
For a full breakdown of what sits behind the category – including how restaurant data analytics works and why it matters – see our guide to restaurant data and analytics. Below we focus on how to evaluate and choose a platform.
Key features to look for in restaurant analytics software
Not all restaurant analytics tools are built the same, and the feature list matters less than whether those features actually get used. The best platforms make sure the right insight reaches the right person – a GM checking today’s covers, a finance lead comparing sites, an ops director spotting a trend before it becomes a problem.
POS, labour & inventory in one real-time view
This is the baseline. Your platform should connect sales, labour and inventory data automatically, so you can see how they relate to each other without exporting CSVs and building a spreadsheet yourself. If a system can only show you sales in isolation, it’s a reporting tool, not an analytics platform.
AI forecasting & predictive analytics
Look for a platform that goes beyond historic reporting and forecasts what’s coming – demand, staffing, stock levels – using AI models layered with external factors like weather, seasonality and local events. Tenzo’s forecasting uses this approach to help operators plan with more precision than sales history alone allows.
Multi-site & group reporting
For multi-unit operators, this is often the deciding factor. Can the platform roll up performance by region, brand or group, while still letting individual GMs see only what’s relevant to their site? A system that only works well for a single location won’t scale with you.
Integrates with your operational tech stack
Switching your entire tech stack to adopt a new analytics layer is unrealistic and impractical, so integration breadth matters. Tenzo connects with 90+ platforms, including Lightspeed, Zonal, Tevalis, Square and Oracle Micros – see the full integrations list – meaning you can keep the systems you already run and add analytics on top, rather than ripping and replacing.
Types of restaurant analytics tools & platforms
‘Restaurant analytics software’ isn’t one category – it covers a few genuinely different types of tools, and confusing them is where most buyers waste time evaluating the wrong shortlist.
1. POS-native reporting
The reporting built into your POS system. Useful for a quick sales snapshot, but limited to whatever that one system sees – it won’t tell you how labour or inventory relate to sales, and it rarely handles multi-site roll-ups well. Fine as a starting point, not built to run a group.
2. Generic BI tools
Platforms like Power BI or Tableau can technically ingest restaurant data, but they weren’t built for it. Someone on your team has to build and maintain the models, define what “covers” or “attachment rate” mean in the system, and keep it updated as your stack changes. Powerful in the right hands, but the setup cost is real – this is usually a multi-month project, not a plug-in.
3. Purpose-built restaurant analytics platforms
Software built specifically for hospitality, with restaurant-specific metrics, benchmarks and integrations already defined. Sales, labour, inventory and forecasting sit together out of the box, because someone already did the work of knowing what a GM or a finance lead actually needs to see. This is where Tenzo sits, and it’s generally the fastest route from “we have data” to “we’re acting on it.”
The right choice depends on how much internal resource you have to build and maintain a system versus how quickly you need it working. For most multi-site operators, the build cost of a generic BI tool outweighs the flexibility it offers.
How to choose the right restaurant analytics software
Before comparing platforms, get clear on what you’re actually trying to fix. Are you solving an operational problem – labour costs, waste, forecasting – or a reporting problem – too many spreadsheets, no single source of truth? The two overlap, but starting with a clear view of what success looks like will save you from choosing a platform with features you’ll never use.
Evaluation checklist
Work through these before you commit to a shortlist of software:
- Data sources: Does it connect to your existing POS, labour and inventory systems, or will you need to switch providers to adopt it?
- Ease of use: Will your GMs get what they need without wading through metrics that don’t apply to them? Will head office get the granularity to compare across sites or brands?
- Support: Is there help available for onboarding, training, and when something breaks or are you on your own after the sale?
- Time-to-value: How long until the platform is actually delivering insight, not just live? Days and weeks are very different commitments to make.
Pricing models – what to expect
Pricing for restaurant analytics software generally falls into one of three models, and it’s worth understanding which one you’re being sold before comparing quotes.
Large upfront investment to custom build
Some providers charge a significant setup fee to build and configure the platform around your specific stack, then a smaller ongoing fee for maintenance. This can work if you need heavy customisation, but it front-loads the cost and risk before you’ve seen any value – and it tends to suit larger enterprises with the budget and patience for a longer build phase, rather than a group looking to move quickly.
Per-seat pricing
You pay based on the number of users who need access – GMs, ops leaders, finance. This scales predictably as your head office team grows, but it can create awkward incentives around who “needs” a login, and costs can creep as more people across the business want visibility.
Per-location pricing
You pay based on the number of sites connected, regardless of how many people at each site use the platform. This tends to suit multi-site operators best, since it scales with the part of the business that’s actually growing – new openings – rather than penalising you for giving more of your team access to the data.
Tenzo fits into this category, per-location: pricing scales with your estate, not your headcount, so head office can give every GM and finance lead the access they need without the cost creeping every time someone new joins the team.
Build vs buy
Some operators consider building their own reporting suite in-house – pulling data via APIs and building dashboards internally. It’s possible, and for a business with in-house data engineering resource it can work. But it’s rarely cheaper once you account for ongoing maintenance, and it means your team is maintaining a reporting tool instead of running the business. We’ve written about what that actually involves in building your own restaurant reporting suite – worth reading before deciding either way.
Best restaurant analytics software compared
Here’s how the main categories stack up against each other on the criteria that actually matter for multi-site operators:
| Capability | Tenzo | Generic BI tool | POS-native reporting |
|---|---|---|---|
| Real-time multi-site view | Yes | Partial | No |
| AI forecasting | Yes | No | No |
| 90+ integrations | Yes | Varies | No |
| Built for restaurants | Yes | No | Yes |
| Setup time | Days | Weeks – months | n/a |
The gap that tends to matter most in practice is setup time. A generic BI tool can technically do most of what a purpose-built platform does, but only after someone on your team has defined every metric and built every model from scratch – that’s weeks or months before it’s useful, not days.
Tenzo’s restaurant analytics software
Tenzo pulls data from your POS, labour, inventory, reservations and reviews – plus external factors like weather and local events – into one real-time view. No spreadsheets, no waiting until month-end to find out what went wrong.
Automated reporting for data-driven decisions
Because Tenzo connects directly to your other systems, trends are visible at a glance with no manual data entry and no risk of transcription errors. Thousands of pre-built reports cover the metrics most operators need out of the box, and the card creator lets you build your own where it doesn’t.
Predictive analytics for demand forecasting
Tenzo’s AI forecasting layers historical sales with weather, seasonality, holidays and local events to forecast demand with up to 30% more accuracy – helping you order and staff for the week you’re actually going to have, not the one your spreadsheet assumed. Operators using this approach have seen COGS reduced by 3–5% through tighter inventory and demand planning.
Ask it in plain English
Tenzo’s AI Connector (MCP) takes this a step further, connecting your operational data directly to the AI tool your team already uses – Claude, ChatGPT, or otherwise – so you can ask a plain-English question and get a joined-up answer across sales, labour and inventory in seconds, not a report request.
See Tenzo’s analytics platform in more detail, or explore how it works for your sites specifically.
Conclusion
Choosing the right platform comes down to one question: will it get insight to the people who need it, before the moment to act on it has passed? The features, integrations and pricing model all serve that one goal. Use the checklist and comparison above to test any platform against it – including Tenzo’s.
If you’re ready to see how Tenzo performs against your own stack, book a demo.

If you’re spending more time compiling reports than acting on them, that’s the problem Tenzo solves.
FAQs
Most asked questions
Pricing generally falls into three models: a large upfront investment to custom build a platform around your stack, per-seat pricing based on how many users need access, or per-location pricing based on the number of sites connected. Per-location pricing tends to suit multi-site operators best, since it scales with new openings rather than penalising you for giving more of your team access. Tenzo uses this model, so cost grows with your estate rather than your headcount.
The first thing to look for is whether your software is capable of real-time consolidation across all your sites – you want one view of performance rather than site-by-site logins. Beyond that, look for group and regional roll-ups as well as role-based views so GMs and head office see different levels of detail. It’s also pretty integral that the integrations match your existing POS and labour systems.
POS-native reporting only sees what your POS sees, and rarely handles multi-site well. Generic BI tools like Power BI can be configured for restaurant data, but someone has to build and maintain the models from scratch and tailor them to the hospitality context. Purpose-built restaurant analytics platforms come with hospitality-specific metrics and integrations already defined, so they’re typically faster to get value from. See our types of tools breakdown above for more detail.
Most purpose-built platforms do, though the breadth varies significantly by provider. Tenzo connects with 90+ platforms including Lightspeed, Zonal, Tevalis, Square and Oracle Micros – see the full integrations list to check your own stack.
The best fit for multi-site operators is a platform that handles group-level roll-ups without losing site-level detail, connects to the systems you already run, and brings you value in days rather than months of setup. Tenzo is built specifically for this – real-time multi-site reporting, AI forecasting, and broad integration coverage out of the box.
With a purpose-built platform like Tenzo, implementation is typically measured in days, not months because the integrations and hospitality-specific metrics are already built and onboarding is mostly about connecting your existing systems rather than building anything from scratch.
Yes. The better platforms use AI models layered with historical sales and external factors like weather, seasonality and local events. Tenzo’s forecasting uses this approach to help operators plan staffing and stock with more accuracy than sales history alone.