The ultimate daily restaurant report (+ free excel template)

Running a restaurant without a daily report is like driving without a dashboard – you might feel fine, but you won’t know there’s a problem until it’s too late. A well-structured daily restaurant report covers five things: sales vs budget, labour cost, cost of goods (theoretical), cross-site comparison, and qualitative notes from the floor. This post explains what each component should include, how to structure it, and how to make the whole process take under 10 minutes a day.
The truth is, restaurant end-of-day reports can be a pain to do. Whether you’re a restaurant manager who’s just finished a long shift and you have to sit at a computer for half an hour inputting numbers into tiresome spreadsheets, or you’re in head office, waking up to potentially dozens of emails and different spreadsheets, which invariably include errors.
However, daily reports are a necessity to run a successful F&B business. Having knowledge of how your business is performing on a day-to-day basis, where you’re aware of any issues that arise as they happen, is incredibly important in this ever-changing world. And actually they don’t have to be the bane of every restaurateur’s life.
It’s important to remember, though, that these daily restaurant manager reports need to be simple. It’s not the same set of information that you will have in your weekly or monthly reports, but instead the main operational information for your business.
Looking for a way to automate all your reports? Tenzo sends you the KPIs that matter most to you as often as you want them!
What makes up an ideal end-of-day or daily restaurant report?
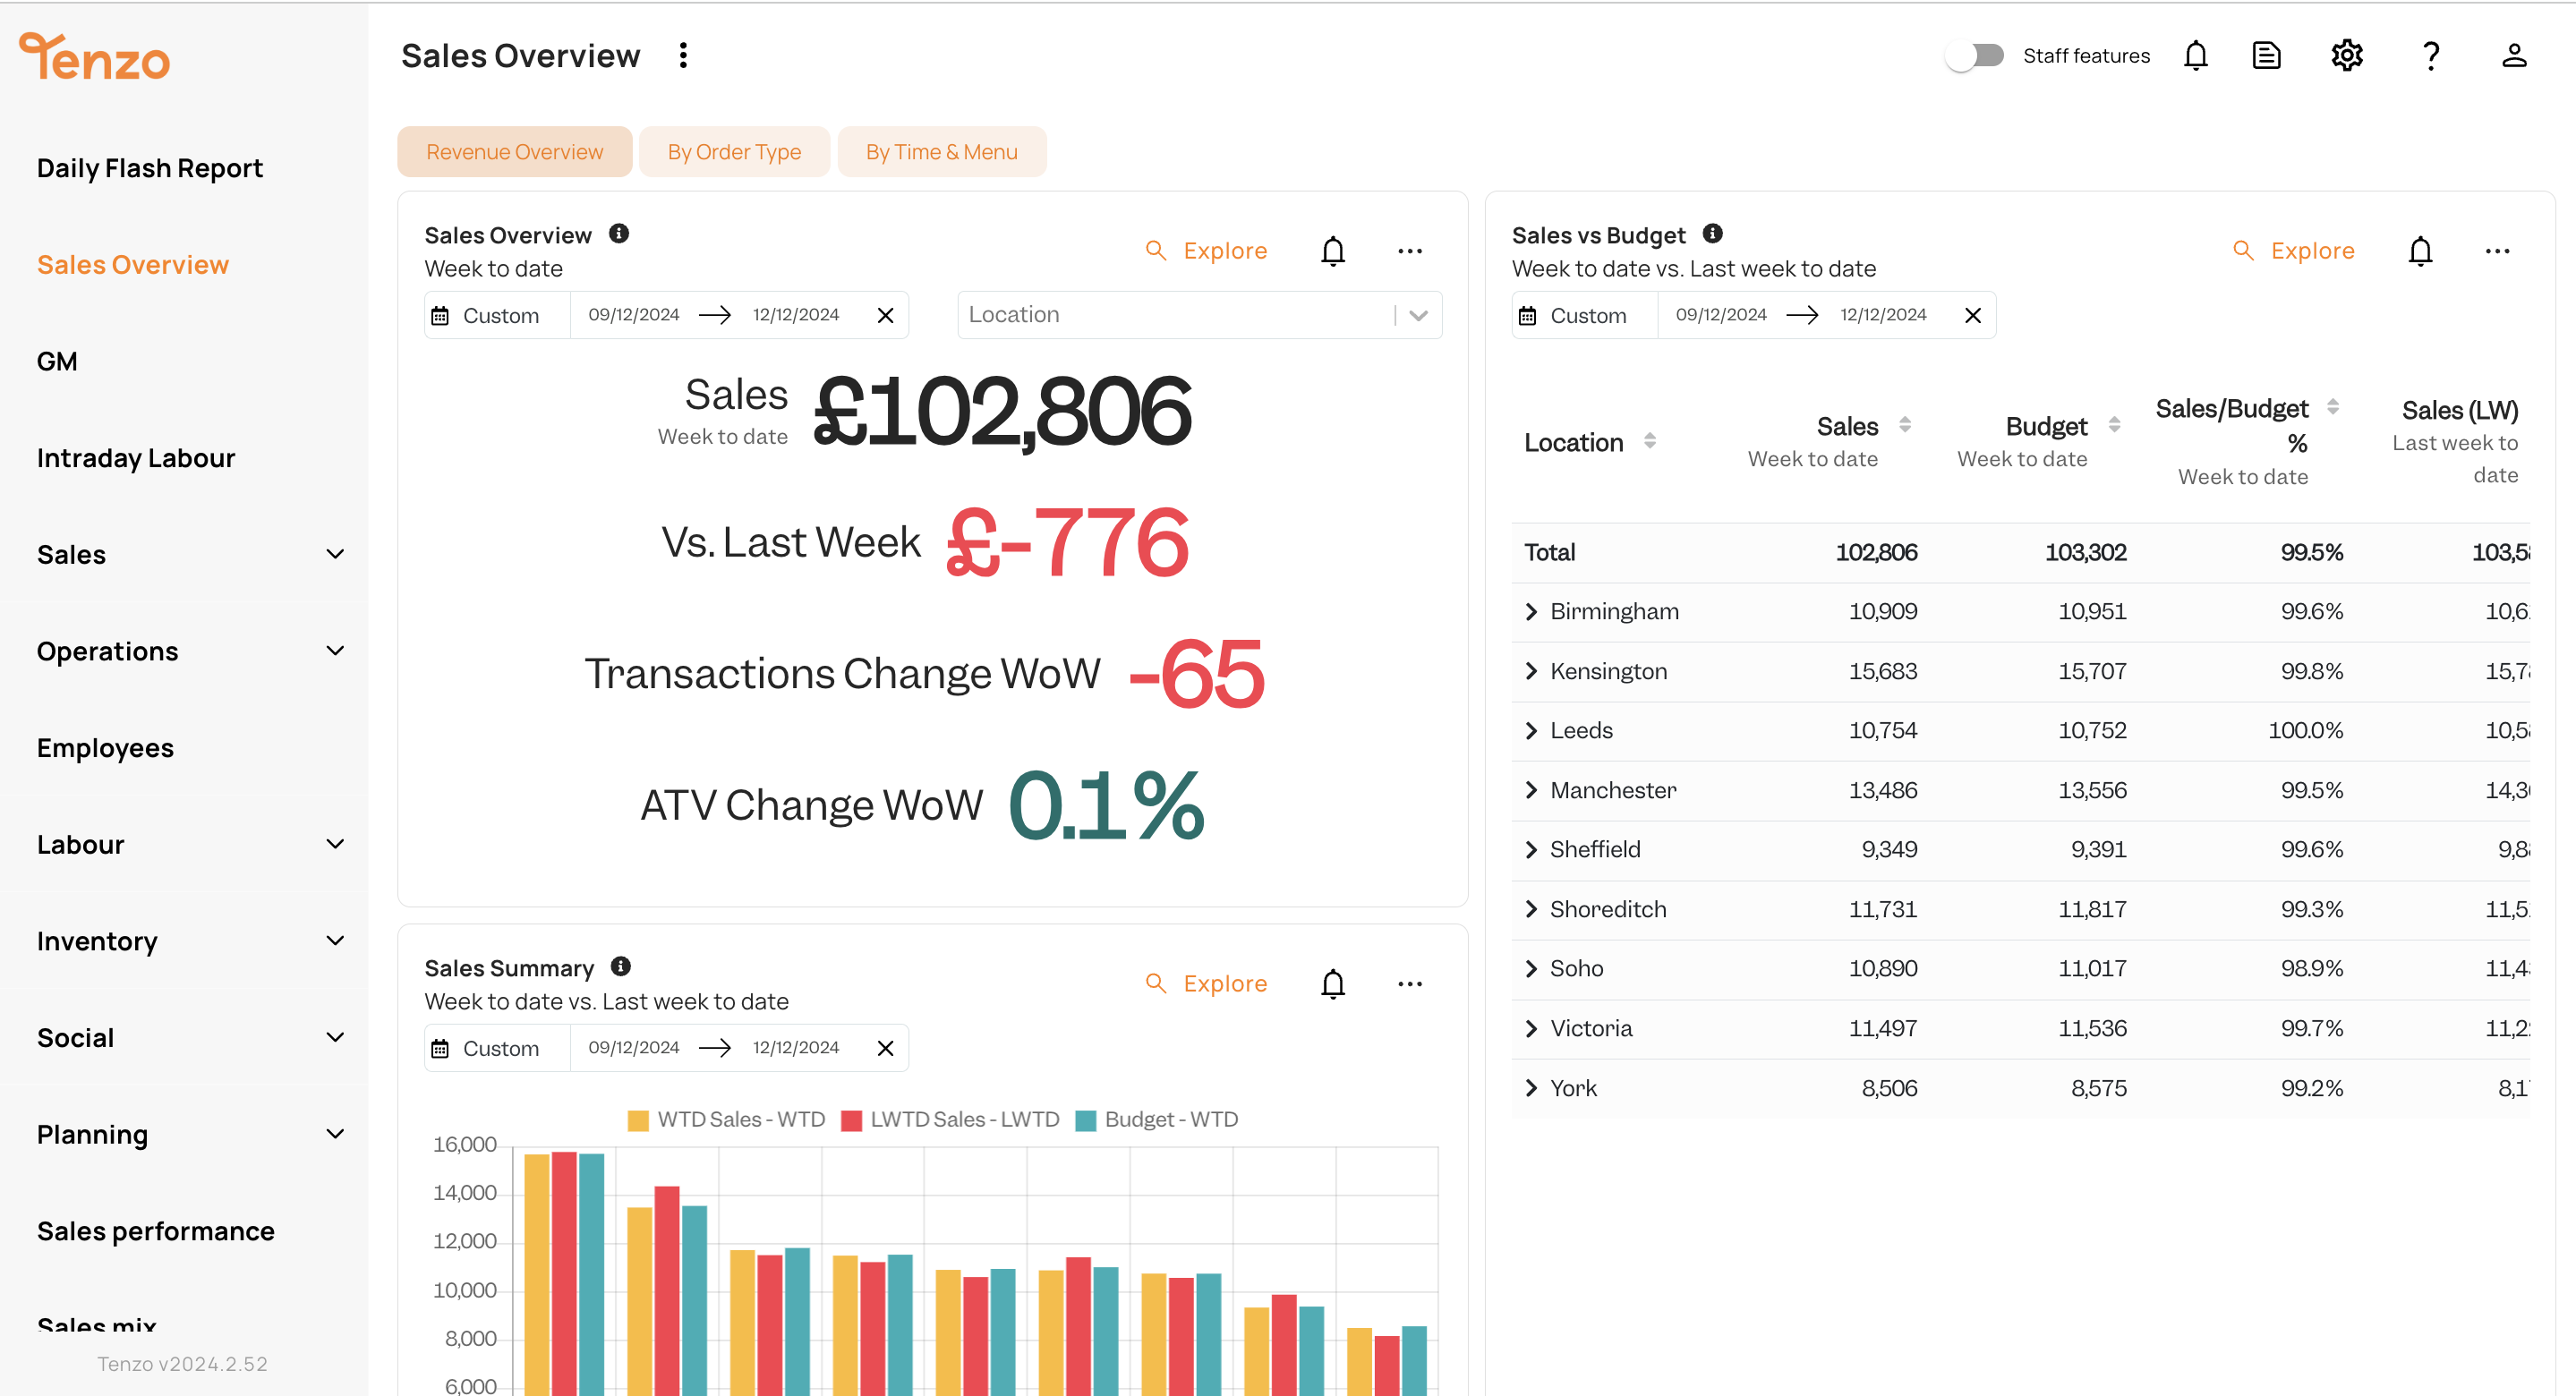
The first thing you’ll want to know is how much revenue you took in for the day. Just having the total number is helpful, but it’s even better if you can see what your revenue looks like in relation to your planned budgets.
A useful element of having daily sales reports is to compare it to the amount you know you need to make to be in the green, after fixed costs like rent, utilities, and salaries come into play. Your budget should reflect that number (it’s especially helpful if that number is dynamic depending on the time of year, day of the week, etc.)
Breaking monthly budgets down to a day level – accounting for day of week, seasonality, and local factors – gives managers a realistic daily target rather than a flat average. Tools like Tenzo do this automatically using your historical POS data, so the number a manager sees each morning reflects what they should actually expect to take that day.
If you want to go even further, getting an idea of when these sales occur could also be helpful. This means separating sales by day part to see how much revenue was taken in at breakfast, lunch and dinner. If you have multiple sales channels, you can also do this for revenue streams such as Delivery, Click & Collect, and Eat-in.
The only other metric you may want to consider is seeing like-for-like performance with the previous year to understand how your operations compare.
How to report on labour costs daily
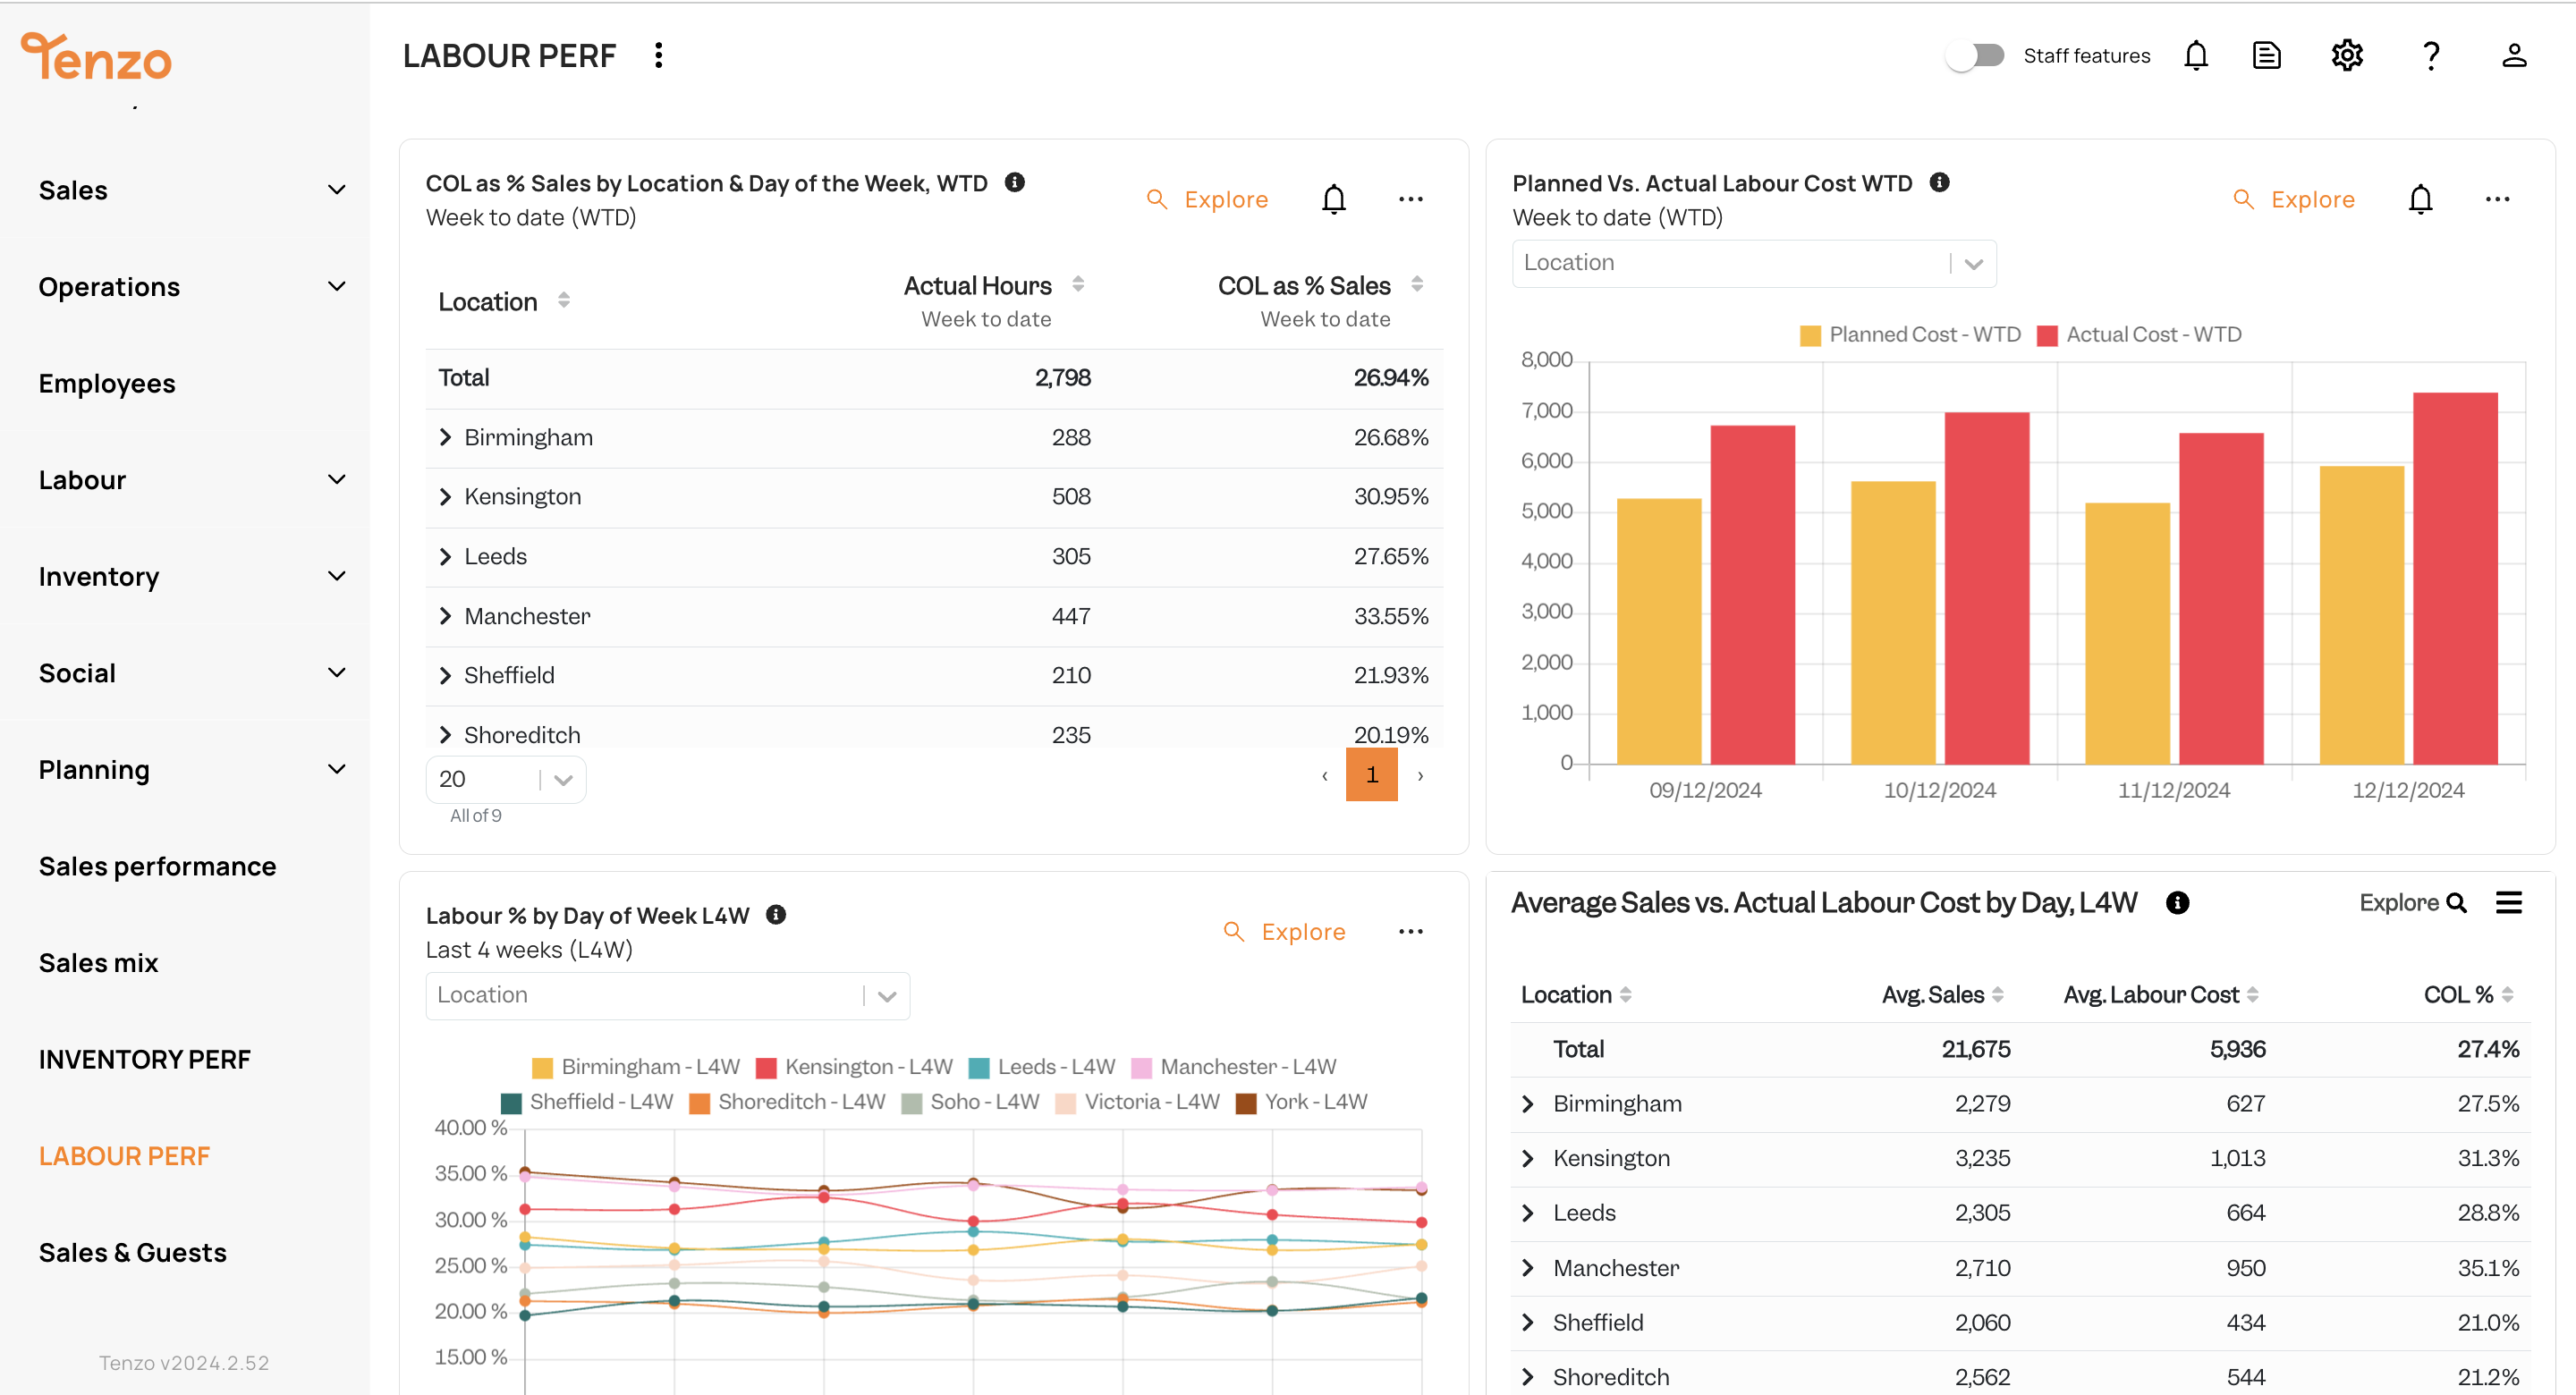
The next thing you’ll want to focus on is your costs. Operationally, you have two major costs: labour/staffing and your cost of goods. The one that has the most effect on a daily basis is your staffing costs as these can fluctuate depending on the day of the week / how busy you are.
There are two different types of labour reports:
- Planned Labour: this is the amount of labour hours you have planned for the day.
- Actual Labour: this is the amount of labour hours that actually took place. This deviation can occur due to no-shows from your team, or from having to send people home early or call people in because you were quieter/busier than expected.
In an ideal world, your planned and actual labour cost would be the same, but this is not usually the case for reasons both in and out of your control. So reporting on actual labour cost as well as what percentage that is of your revenue can be helpful to keep an eye on daily fluctuations.
A note on daily cost of goods reports
As mentioned above, the second of your major operational costs is your goods. It is obviously important to keep track of how much you spend on ingredients to make sure that you are not over-ordering and therefore creating a lot of waste, or under-ordering and therefore running out of certain dishes.
However, unless you have impeccable recipe management where each ingredient is measured to the gram, keeping track of your daily actual cost of goods sold is near impossible. Therefore, keeping track of your theoretical usage (i.e. sales multiplied by recipes) is a better bet. You can then adjust on a weekly basis as you do your stock counts and see how much variance there is between actual and theoretical.
Comparing all of your locations
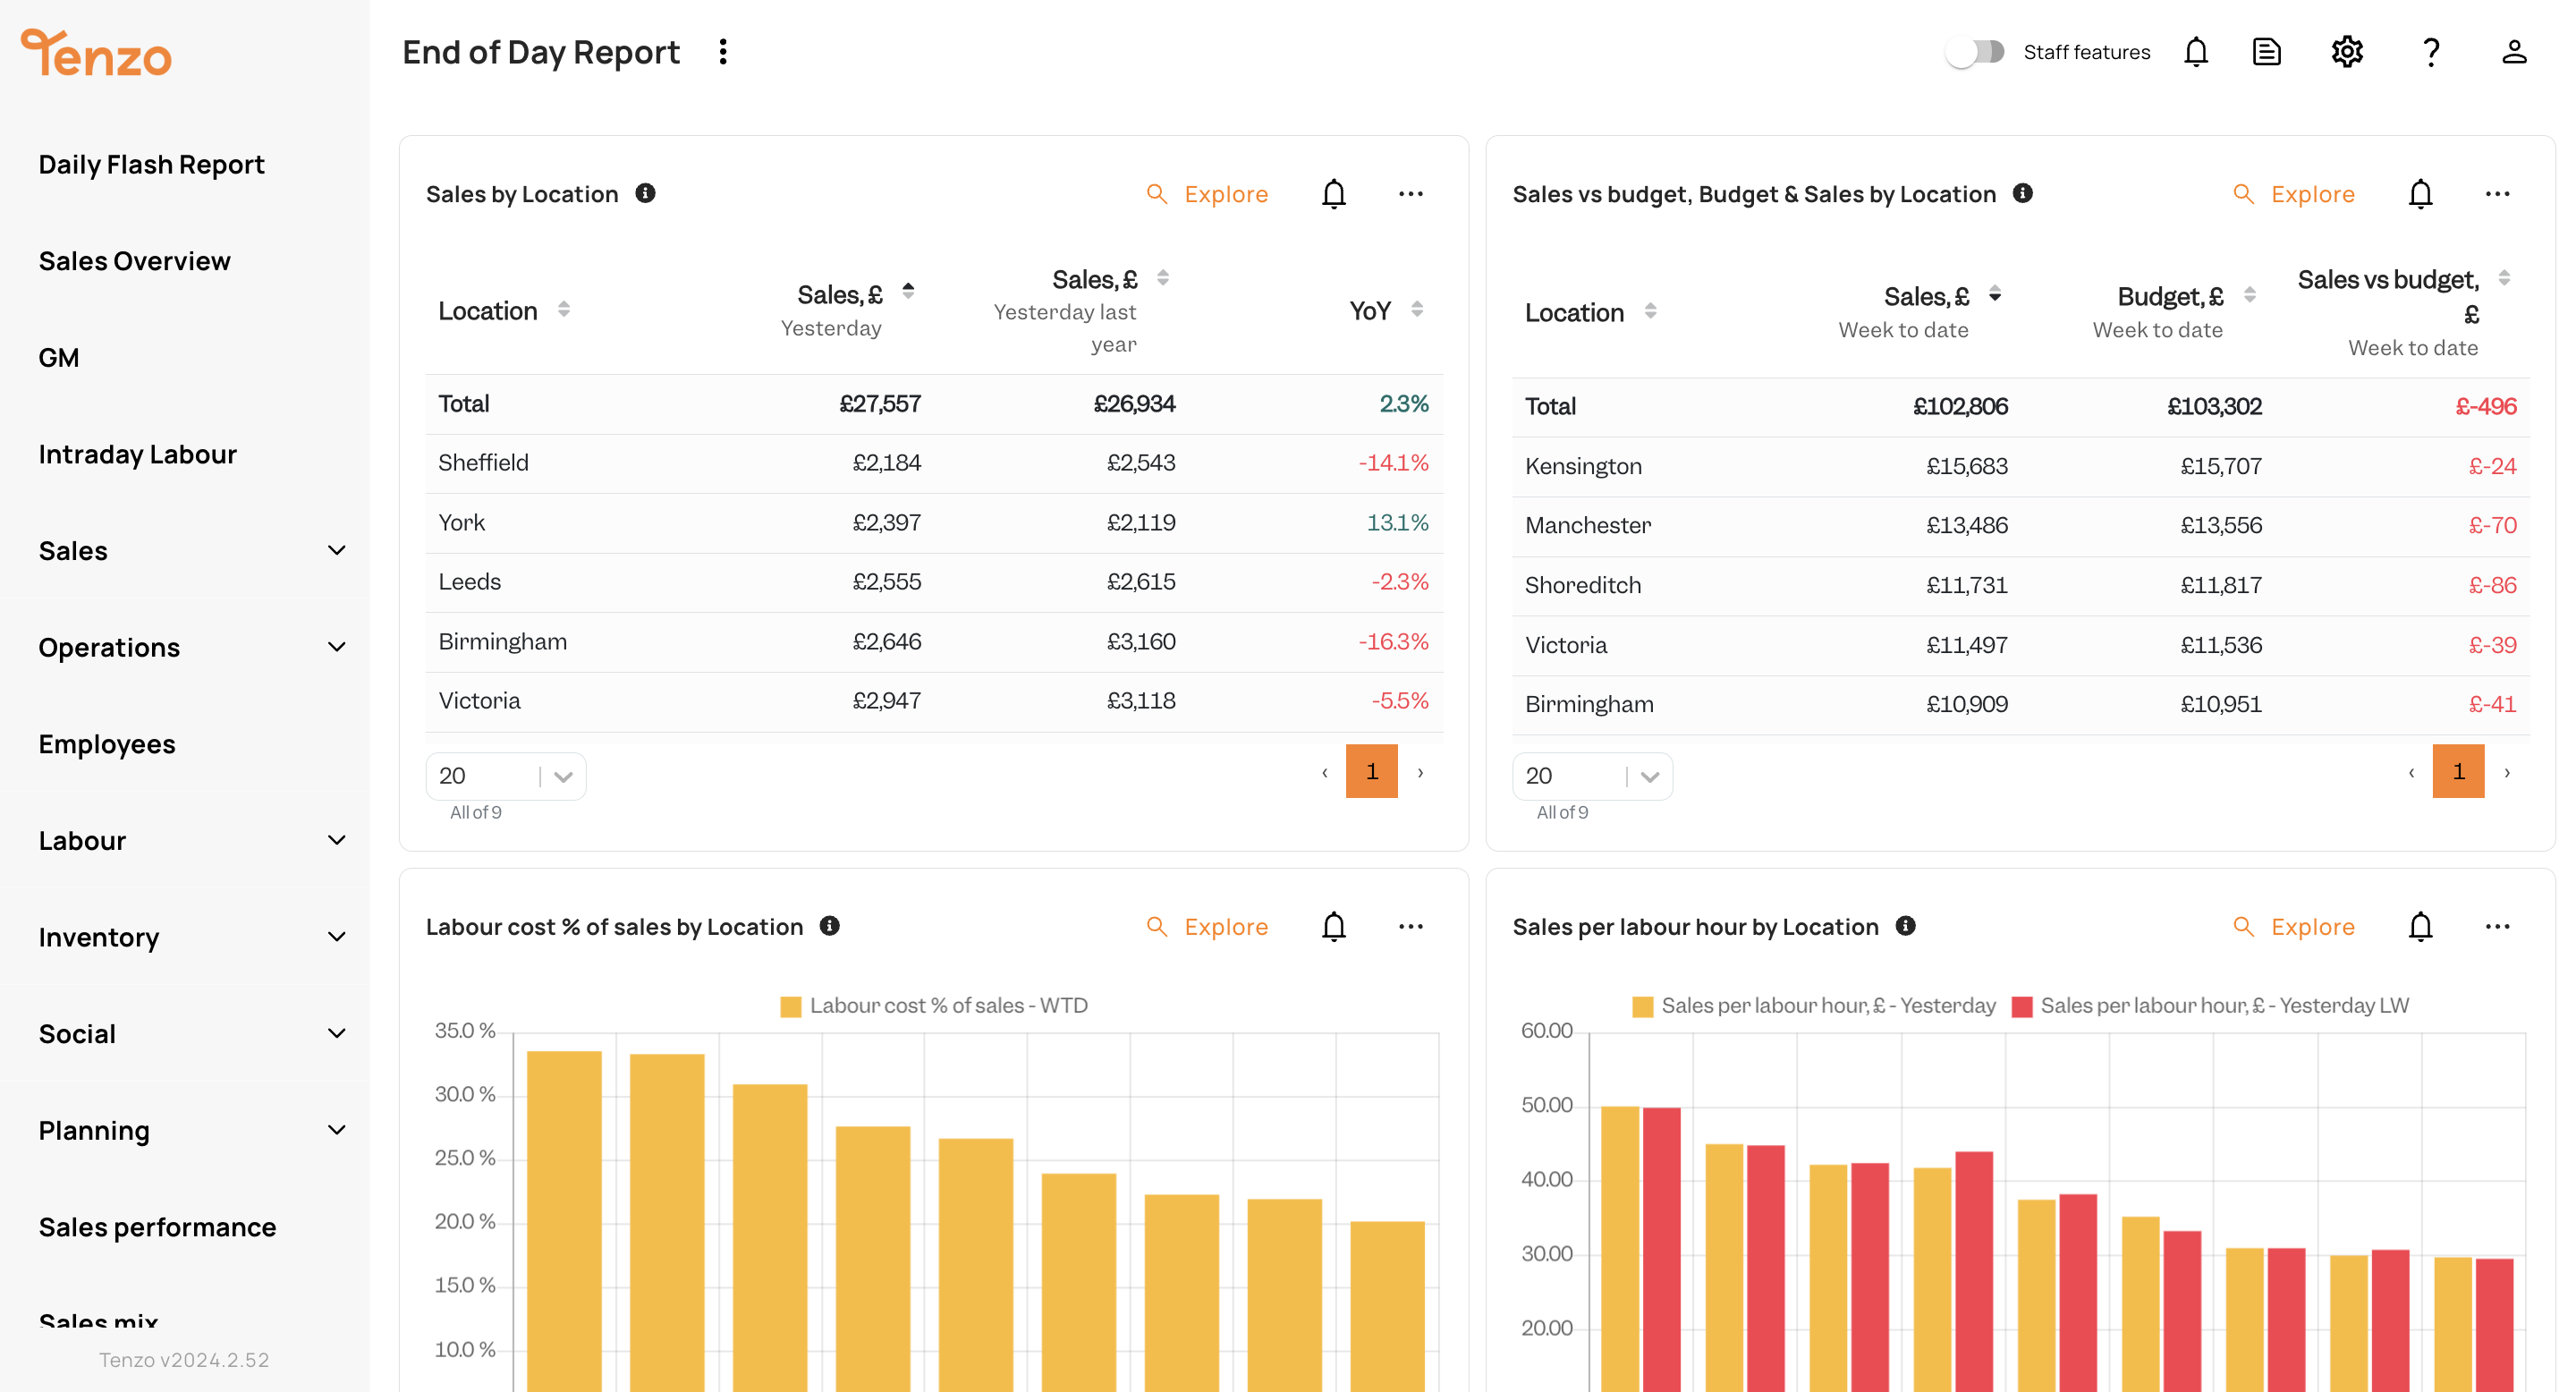
In a multi-location business, seeing how each of your sites are performing compared to each other is incredibly insightful. You can see the state of the business as a whole instead of in bits and pieces. Plus, you can easily see which locations might need a bit more help or spot anomalies which need your attention.
Daily fluctuations are of course totally normal, but if anything is flagged as out of the ordinary the day of, you’re far more likely to be able to nip any issues in the bud before they become big ongoing problems.
What your end-of-day reports are missing
Running a restaurant isn’t just about the numbers though. Reporting on maintenance issues, absences, guest relations and the like is just as important and gives you a real overview of the goings-on in the business.
Many of our Tenzo customers use specific daily report templates that are filled in every day so that nothing slips through the cracks. Some have longer templates than others, but across the board these report templates include the basic elements of:
- Front of House and Service
- Back of House and Product
- People
- Guests
- Maintenance
- External factors
- Other comments
Tenzo actually has a feature called ‘logs’ that allows the team to make these comments straight from their phone in the app. That means they can fill it out on their commute home instead of having to stay at the restaurant.
Plus all these logs can be automatically sent to HQ in one report so no more waking up to dozens of emails! You can also search for keywords in past logs so you know when the last time the fridge broke was, who reported it and what location it was in.
The ultimate daily restaurant report
Bring all these elements together and you’ve got the ultimate report! We’ve created an Excel template where you can input all your numbers from your point-of-sale, payroll and inventory system to get your daily overview. It’s got separate worksheets for each of your businesses and you’ll be able to recreate the same format every day.
You can download your free daily restaurant report template as an Excel file here:
If manually inputting all those numbers is too much to bear, have no fear Tenzo is here for you. We integrate with all your different systems (yep, your POS, your labour tool and your inventory tool) and automatically send you the KPIs you need so you never have to worry about a mistyped ‘9’ instead of ‘0’. We then facilitate easy qualitative feedback thanks to our log function. All that information can then be sent to your inbox at 6am on a daily basis!
You can sign up for a demo and we’ll show you exactly how it works!
FAQs
Q: What should a daily restaurant report include?
A: A complete daily restaurant report covers five areas: revenue vs budget (broken down by daypart if possible), actual vs planned labour cost as a percentage of revenue, theoretical cost of goods based on your sales mix, a cross-site comparison if you operate multiple locations, and qualitative notes covering service, maintenance, and staffing. Keep it to one page – daily reports are for operational awareness, not deep analysis.
Q: How long should a daily restaurant report take to complete?
A: A manual daily report typically takes 20-45 minutes depending on how many systems you’re pulling from. Automated reporting platforms like Tenzo can eliminate this entirely by sending a pre-built report to your inbox each morning.\
Q: What’s the difference between a daily and a weekly restaurant report?
A: Daily reports focus on operational data you can act on immediately such as today’s labour overspend, yesterday’s revenue shortfall. Weekly reports zoom out to trends, cost of goods variance from your stock count, and performance against monthly targets. Both are necessary; neither replaces the other.
Q: How do multi-site restaurant groups handle daily reporting?
A: Multi-site groups typically consolidate daily reports at group level so the head office can see all locations in one view. The most effective setups flag anomalies automatically – a site that’s significantly over on labour or under on revenue triggers an alert rather than requiring someone to spot it manually.
Q: Can daily restaurant reports be automated?
A: Yes! Platforms like Tenzo integrate with your POS, labour scheduling, and inventory systems to generate and distribute daily reports automatically. The report lands in your inbox each morning with the KPIs that matter, formatted consistently across every site.
You may also like