AI restaurant analytics: the operator’s guide to getting real value

In this article

Dive into your data...
Looking to get the most out of your business' data? Let's chat!
Request a demoAI restaurant analytics turns raw operational data – sales, labour, covers, reviews, reservations – into specific, actionable insights: which sites are underperforming and why, which menu items are draining margin, where labour is being deployed inefficiently. The distinction that matters is between reporting (what happened) and analytics (why it happened and what you should do about it). Most ‘AI analytics’ tools only do the reporting part. Genuinely useful AI restaurant analytics software changes what you do on Monday morning.
Most operators already have dashboards. Sales by site, labour percentages, covers by shift – it’s all there, every morning. And yet, the question that lands on the ops director’s desk at the start of every week is still the same: so what do I actually do about this?
That’s the gap AI restaurant analytics is designed to fill. Not more data – a different kind of output. One that tells you why your numbers look the way they do, and what to do about it specifically enough that you can act on it before the week is out.
This post is for operators and ops directors who already use some form of reporting and want to understand what genuine AI analytics adds on top of it. We’ll cover the difference between reporting and analytics in real terms, three concrete scenarios where AI analytics creates visible value, the data quality problem most tools don’t talk about, and what to look for when you’re evaluating platforms.
Reporting vs analytics: why the distinction actually matters
Most restaurant reporting tells you what happened. Sales were down 12% on Friday. Labour cost was 34% last week. Your lowest-rated site dropped half a star in Q3.
That’s information. It’s useful. But it doesn’t answer the question you’re actually sitting with: so what do I do about it?
Analytics – genuinely good analytics – answers the why and points towards the what next.
Here’s what that looks like in practice. Not: ‘Labour was 34% last week.’ But: ‘Labour was 34% last week because two of your higher-volume sites ran agency cover on Saturday nights, at roughly 2.3x the standard hourly rate, and that pattern has now happened four weekends in a row.’

That’s a diagnosis. And a diagnosis is something you can act on.
The reason this distinction matters right now is that a significant number of tools marketed as ‘AI analytics’ are, in practice, reporting with a chat interface bolted on. You type a question, they query a single data source, and return a number that was already on your dashboard. That’s not without value – but it’s a long way from what AI analytics can deliver when it’s built on a properly connected data model.
The bar for AI analytics should be simple: did it change what you did on Monday morning? If the answer is consistently no, you’re getting faster reporting – not analytics.
What AI restaurant analytics looks like day-to-day
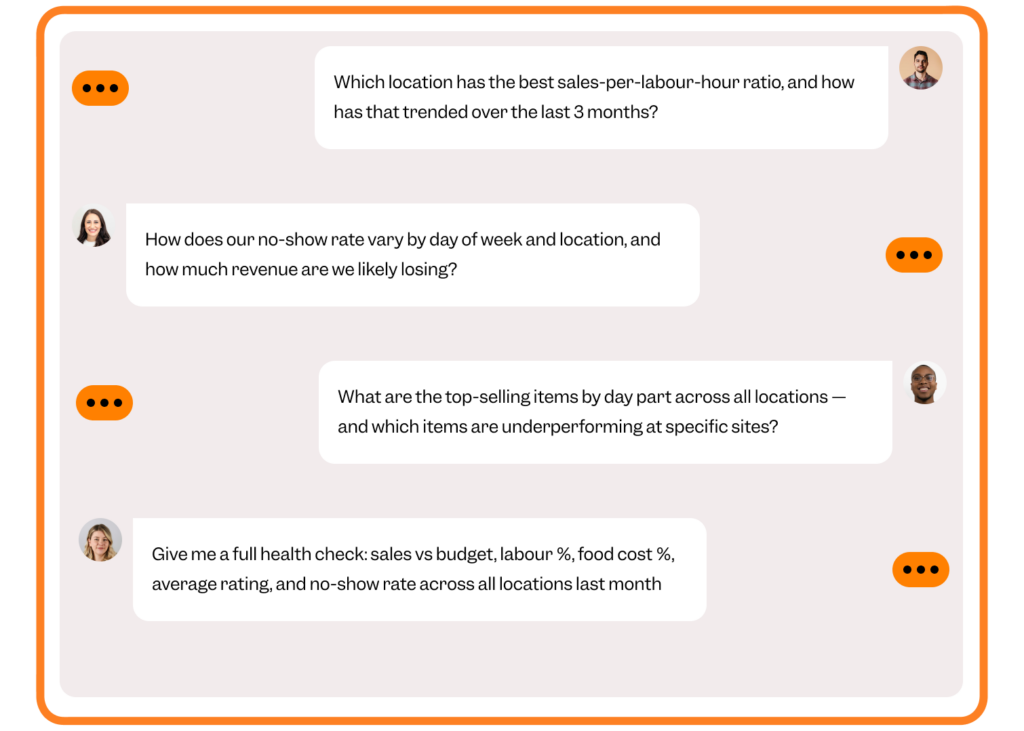
The clearest way to explain this is through specific scenarios. These aren’t hypothetical – they’re the kinds of questions multi-site operators deal with every week.
Labour variance: where is the overspend actually coming from?
You’re looking at your labour report and one site is consistently behind on contribution margin. You know how much – it’s right there on the dashboard. The question is why, and whether it’s a one-off or something structural.
A multi-site bar-restaurant group recently ran exactly this diagnosis using Tenzo’s AI connector. Rather than another report listing where the site was worst, the ops director wanted something he could walk the GM through: what’s wrong, what’s actually fine, and what to fix this quarter. So he pulled last quarter’s data and compared the site to the group across labour productivity, COGS by category, and review themes.
What came back wasn’t a list of problems – it was a layered picture. Labour productivity was the main culprit. But bar discipline was actually above group average. Food COGS was running hot on portioned categories, pointing to a training issue rather than a recipe one. And guest reviews were positive on staff but negative on wait times – consistent with the labour gap, not a separate problem.
The output was five plain-English talking points for the GM conversation and charts ready for the ops review deck. He went in with a diagnosis, not a spreadsheet.
Without joining labour, COGS, and review data in the same place, you only know the site is behind. With it, you know where to start.
Menu margin: which dishes are quietly costing you?
Your food cost percentage looks broadly under control at group level. At dish level, it tells a different story.
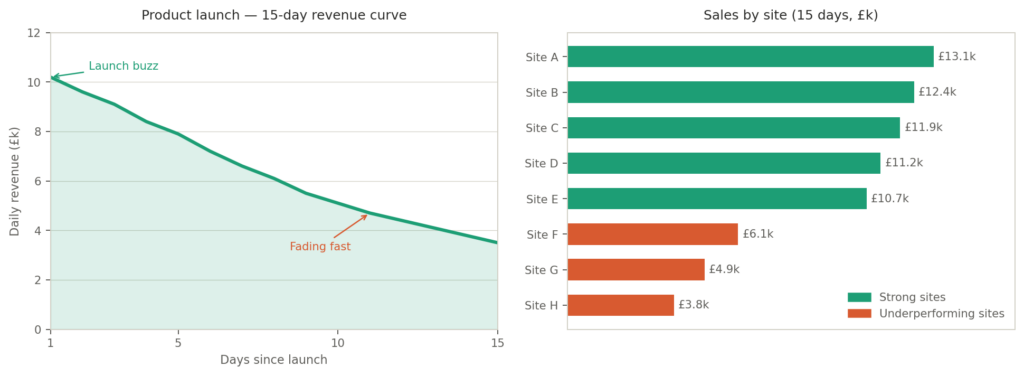
A grab-and-go chain recently launched a new product range across multiple sites. Two weeks in, revenue was coming in – but the numbers couldn’t tell them where the launch was already fading, which sites were underperforming despite healthy group figures, or which dayparts were being left on the table.
They used Tenzo’s AI connector to get a read on the launch: revenue trend, performance by site and by daypart, and three actions for the ops team that week.
The daily revenue curve was already falling. A handful of sites were barely moving units. Almost nothing was selling in the morning. The recommendations were specific: act on retention before the launch buzz dies, visit the lagging sites, and open up the morning daypart with a bundle offering.
That kind of insight only exists when POS data is analysed alongside operational context. If they’re in separate tools, someone builds it manually – usually two weeks after the window to act has closed.
Reservations vs walk-ins: what’s actually more valuable to your business?
Your reservations spend £12 more per head than walk-ins. Most operators see that and think: push reservations harder. But when you analyse covers, revenue, and reservations data together, a more nuanced picture emerges.
Walk-ins often generate more revenue per seat per hour – because they turn faster and don’t hold a table through an extended booking slot. The spend-per-head gap is almost entirely explained by dwell time, not ordering behaviour.
The action here isn’t a pricing change or a policy shift. It’s drinks attachment training – because the revenue-per-seat-per-hour gap narrows significantly on nights where your floor team is actively selling. That’s a coaching conversation, not a commercial restructure. And it only becomes visible when covers and revenue data are analysed together.
In all three scenarios, the value is in the specific, actionable output – not just the number. A report tells you walk-ins spend less per head. Analytics tells you why, and what to do about it.
The AI data quality problem that most platforms don’t talk about
Here’s the honest bit that’s easy to miss.
AI restaurant analytics is only as useful as the data feeding it. And for most multi-site restaurant groups, the data has a structural problem: it’s spread across five to fifteen separate tools.
Your POS holds sales and covers. Your labour scheduler holds shifts and hours. Your review platform holds guest sentiment. Your inventory system holds stock movements. Your manager logs hold the qualitative context that explains why the numbers look the way they do. Each of these is a partial picture. The insight you actually need almost always requires joining two or more of them.
Take a common analytical question: why are my review scores lower on certain days? A single-source analytics tool can tell you what your reviews look like. It cannot tell you that on your worst-reviewed days, your front-of-house team was running 5% below planned hours while covers were 17% above plan – which is likely the real driver. That cross-source analysis requires labour, covers, and review data to be in the same place at the same time.
Most restaurant groups know their data is fragmented. What they underestimate is how directly that fragmentation limits the quality of AI output sitting on top of it. The most sophisticated model in the world, applied to single-source data, still gives you single-source answers.
Connecting your data sources isn’t glamorous work. But it’s the thing that determines whether the investment in AI analytics pays off.
How Tenzo approaches AI restaurant analytics
The three scenarios above – labour variance, menu margin, and reservations vs walk-ins – are all cross-domain analyses. Each requires joining multiple data sources at once.
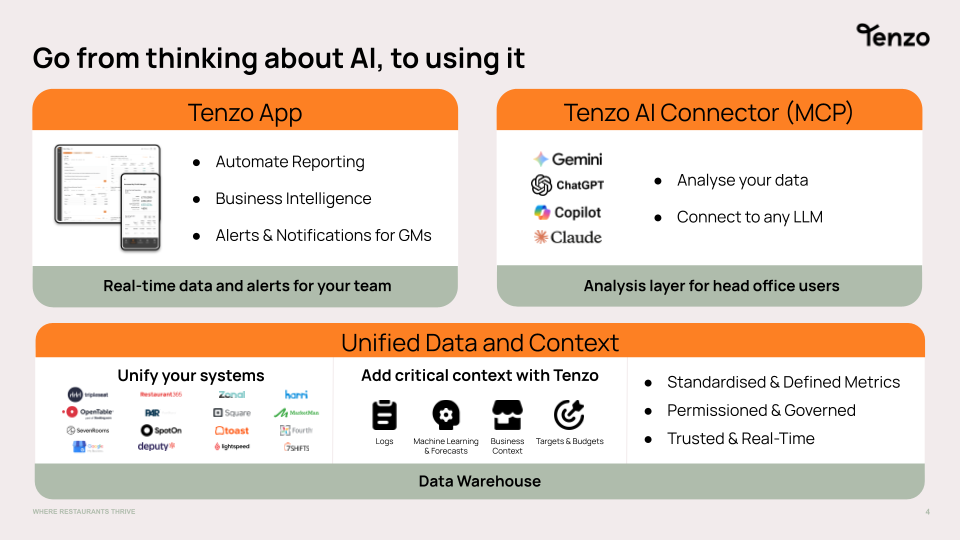
Tenzo connects your entire tech stack – POS, labour, inventory, reservations, reviews, and manager logs – into a single data model. Our MCP (Model Context Protocol) sits on top of that unified layer, so when you ask an analytical question, the answer draws on all of your data simultaneously – not just the slice that lives in one tool.
The review correlation analysis – where worst-reviewed days track against understaffed shifts and over-capacity covers – is only possible because all three data types live in one place. The labour variance scenario, where five out of fifteen high-cost days show a corresponding manager log entry, is only surfaceable because manager logs are treated as a first-class data type in Tenzo, queryable alongside transactional data rather than stored separately and read manually.
What makes Tenzo different from standard BI tools isn’t just the number of sources it connects. It’s that we understand the value of business context – how your group defines a cover, what you call your sites, what your targets are. That context is what turns a data query into an answer you can act on.
How to evaluate AI analytics tools for your restaurant group
Before committing to any AI analytics platform – or continuing to pay for one you’re already using – these are the questions worth asking.
1. Does it join data across your actual systems, or query them one at a time?
Ask the vendor to demonstrate a cross-source analysis live – not in a pre-recorded demo. If they can’t, the tool is single-source regardless of what the marketing says.
This matters for a reason most operators haven’t felt yet but will: token costs. Uber’s 5,000 engineers burned through their entire 2026 AI token budget in four months. 71% of companies exceeded their AI budgets last year. The new CFO headache isn’t seat licences – it’s token anxiety.
If your AI analytics tool has to stitch your POS, labour, and inventory data together on every query, you’re burning tokens just to assemble the question before it’s even been answered. A tool built on a unified data model – where the joins are done once, at the infrastructure level – means the AI spends its tokens answering your question, not unpacking it. Cheaper queries. Faster answers. Better decisions at scale.
2. What happens when you ask a question it can’t answer?
A good tool tells you it doesn’t have the data. A bad tool makes something up, returns a confident-sounding non-answer, or quietly redirects to a question it can answer.
The moment a GM or ops director gets a fabricated insight and acts on it, trust in the whole system collapses. Before you commit to any platform, ask it something genuinely hard. Ask about a data source it might not have. Ask a question that requires context it hasn’t been given. How it handles the edges tells you more about its reliability than how it handles the easy queries.
3. Does it serve both the people doing the analysis and the people acting on it?
In most multi-site groups, head office runs the analysis and sets the targets. GMs track their performance against those targets in real time.
For ops directors and finance leads, that means being able to run cross-source analyses, surface underperformance across sites, and turn the output into targets and talking points. For GMs, it means a mobile dashboard that shows how their site is tracking – without requiring them to interrogate data or interpret reports. The insight flows down.
A tool that only works for one of these audiences will either bottleneck at head office or go unused on the floor.
4. Are manager logs and qualitative context included, or is it purely transactional?
This is the question most operators don’t think to ask. It’s often the one that determines whether the tool can explain why things look the way they do, or only describe what happened.
Transactional data – sales, covers, labour hours – tells you the shape of the problem. Qualitative context tells you the cause. A site that underperformed on three consecutive Saturdays looks different when you can see the manager log entries noting a staff shortage, a local event, and a kitchen equipment issue. Without that layer, you’re diagnosing with half the information.
The best platforms treat manager notes, event flags, and operational commentary as first-class data – queryable alongside your transactional data, not stored separately and read manually.
5. Does it connect to your actual tech stack?
A beautifully designed analytics platform that doesn’t integrate with your POS, your labour scheduler, and your reservations system is a standalone tool – not an analytics layer. The value of AI analytics compounds with every additional source it can draw on. A single integration gap means a whole category of questions it can’t answer.
Before signing anything, map your current tech stack and ask the vendor to walk through each integration specifically – not just confirm that a connector exists. Ask how it handles data conflicts between systems, how often the sync runs, and what happens when an integration breaks.
The operators getting real value from AI restaurant analytics aren’t the ones with the most sophisticated tools. They’re the ones who’ve connected their data, set the right bar for what ‘analytics’ actually means, and used AI to surface the answers that change what happens on the floor.
If you want to see what that looks like with your own data, book a demo and we’ll show you exactly what Tenzo can surface for your group.
See how Tenzo can help you hospitality business and surface real insights.
Learn more today.
Frequently asked questions
AI restaurant analytics refers to software that uses machine learning and large language models to analyse operational data – sales, labour, covers, inventory, reviews, manager logs – and surface specific, actionable insights rather than just reporting what happened. The distinction from standard restaurant reporting is that AI analytics answers the why and points towards a clear next action, rather than presenting numbers for a human to interpret.
A standard dashboard shows you what happened – sales figures, labour percentages, cover counts. AI analytics tells you why it happened and what to do about it. The practical difference is in the output: a dashboard shows you that labour was 34% last week; AI analytics tells you that the overspend was concentrated on two sites running agency cover on Saturday nights at 2.3x the standard rate, and that the pattern has repeated for four weeks. One is information. The other is a diagnosis.
At minimum, clean POS data (sales and covers) and labour data. From there, each additional source unlocks more cross-domain analysis – inventory data enables menu margin analysis, review data enables sentiment correlation, and manager logs provide the qualitative context that explains why the numbers look the way they do. The key factor is whether those sources are connected: data sitting in separate tools can only be analysed in isolation, which limits the depth and accuracy of AI output significantly.
Because connecting multiple data sources is technically harder than querying one. Most tools are built on a single data source – typically POS – and surface that data through a conversational interface. The marketing describes this as AI analytics; in practice it’s faster reporting. Genuinely multi-source AI analytics requires a unified data model that connects your POS, labour, inventory, reviews, and operational logs before any AI layer is applied. That’s a harder build, but it’s what makes cross-domain analysis possible.
They should be able to – and if they can’t, that’s a signal about the tool, not the GM. The best AI analytics platforms surface insights in plain language: what needs attention, why, and what to do about it. A GM should be able to log in on a Monday morning and see a clear picture of the week ahead without building a query or interpreting a chart. If the tool requires a data analyst to extract value from it, it won’t change operational behaviour at the site level.
Tenzo connects sales, labour, inventory, reservations, reviews, and manager logs into a single data model – which means AI analytics can draw on all of them simultaneously. Most platforms work with one or two sources. The other distinction is that Tenzo treats manager logs as a first-class data type, queryable alongside transactional data. That qualitative layer – the context your GMs capture every day – is often what turns a data anomaly into an actionable diagnosis.