

Restaurant KPIs: The metrics that actually matter

In this article
Top restaurant KPIs measure a number against a specific business goal – not just any figure you pull from a report; net sales is data, but net sales against last week’s forecast is a KPI. The essentials span five categories – sales, labour, cost of goods, guest experience, and profitability – and each demands its own cadence, from daily labour checks to monthly margin reviews.
What are restaurant KPIs?
The restaurants that run tightest track a small, consistent set of KPIs across sales, labour, cost of goods, guest experience, and profitability, and they review each one on the cadence that matches how fast it moves. Below is a breakdown of the KPIs that matter most, how to calculate each one, and what “good” looks like.
The essential restaurant KPIs, by category
Sales & Revenue
Net sales = total revenue after discounts, refunds, and voids are stripped out. It’s the number every other sales KPI is built on.
Average Transaction Value (ATV) = Total Sales Revenue ÷ Number of Transactions. There’s no universal “good” ATV – it’s driven entirely by concept and price point – so the useful move is tracking it week-on-week and year-on-year rather than chasing a fixed target.
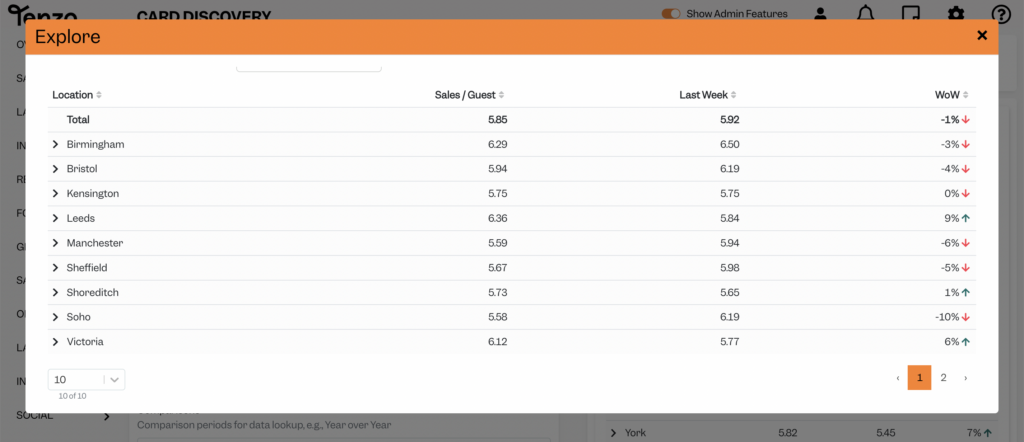
Spend Per Head (SPG) = Total Revenue ÷ Number of Guests. It’s easy to confuse with ATV, but as Tenzo’s guide to average transaction value points out, they’re not interchangeable: ATV is per transaction, SPG is per guest – for a table of 4 splitting the bill across 2 cards, those numbers diverge fast.
Covers = the number of guests served in a given period. The base unit for SPG, table-turn, and most guest-experience metrics.
Labour
Labour cost % = (Total fully loaded labour costs ÷ Total net sales) × 100. Tenzo’s breakdown of cost of labour puts the general rule of thumb around 30% of revenue, though this shifts with service model and prep intensity.
Sales per labour hour = a productivity read rather than a cost read: total sales ÷ hours scheduled. Think of labour cost % as “how much of the pie labour ate” and sales-per-hour as “how efficiently each pair of hands turned effort into sales” – as the same cost of labour piece notes, you can hit a healthy labour % while still running an inefficient rota if hours are badly distributed across the day. Best benchmarked against your own site’s history rather than an industry figure, since it’s highly menu- and format-dependent.
Cost of Goods / Food Cost
Food cost % (COGS%) = (Cost of goods sold ÷ Food sales) × 100. This 2026 profit margins breakdown puts the standard target between 28–32% of revenue for most UK restaurants.
Actual vs. theoretical usage = the gap between what your recipes say you should have used and what you actually used, explained in Defining Actual Usage for Restaurants. That gap is where waste, over-portioning, and shrinkage hide, and closing it can recover 1–3% of food cost without touching the menu at all.
Gross profit % (GP%) = ((Revenue – COGS) ÷ Revenue) × 100. According to our restaurant industry profit margins analysis, a well-run QSR should sit at 70%+, while casual dining typically runs 60–70%. Anything consistently below 60% is worth a close look at pricing, portions, and suppliers before it compounds.
Guest & Service
Review scores = your aggregate rating across review platforms, ideally tracked in one place rather than checked platform-by-platform, since a slow response to a bad review compounds reputational damage.
Repeat/retention rate = the share of guests who return within a given window. Worth tracking because returning customers cost far less to keep than new ones cost to acquire.
Table turn = covers served per table within a service period. More relevant for higher-volume, eat-in-heavy formats than for delivery-first or QSR concepts.
Profitability
Prime cost = Food cost % + Labour cost %. This profit margins guide puts a healthy prime cost for a UK full-service restaurant between 55–65% of revenue, with anything above 70% flagged as a clear warning sign.
Net profit margin = (Net Profit ÷ Total Revenue) × 100. Per the same guide, typical UK ranges run full-service 3–6%, quick-service 6–9%, and delivery/ghost kitchen 10–30% thanks to lower overheads.
EBITDA margin = profit before interest, tax, depreciation and amortisation, as a share of revenue. Used less at single-site level and more for group reporting or investor conversations, since it strips out financing and asset decisions to isolate pure operating performance.
Restaurant KPIs for multi-site & group operators
Every KPI we’ve covered so far still matters once you’re running more than one site. But multi-site operators need three extra layers on top of the basics: roll-ups, site-vs-site comparison, and ranking.
Roll-ups: one number instead of ten reports
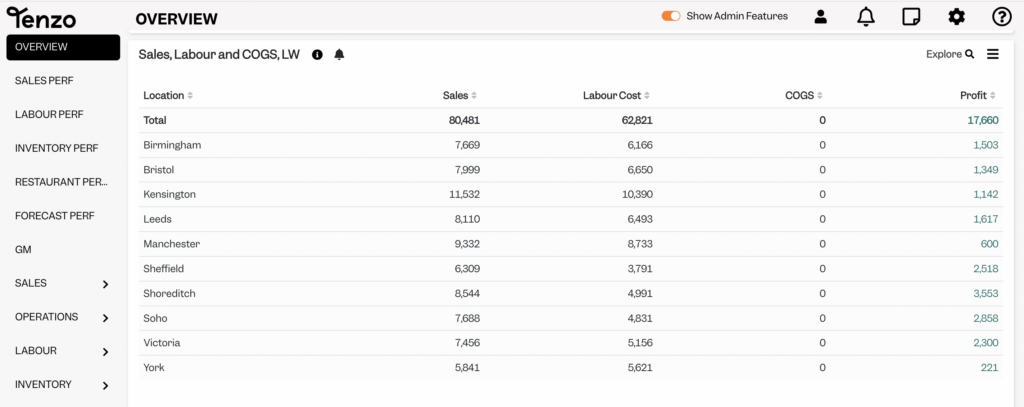
A roll-up consolidates each KPI across your whole estate into a single group-level view, rather than you working through site reports one by one. Tenzo’s guide to restaurant reporting makes the point that the best multi-site setups don’t stop at consolidation – they flag anomalies automatically. If a site is running significantly over on labour or under on revenue, it should surface on its own. You shouldn’t have to go looking for it.
Site-vs-site comparison: like-for-like, not just side-by-side
This is putting the same KPI next to each other across locations to work out who’s actually performing better, and why. It only works cleanly when the metric is genuinely comparable across sites with different footprints. Sales per labour hour (SPLH) is a good example – it lets you benchmark sites of completely different sizes on the same basis. As Tenzo’s piece on productivity metrics puts it, a site running £45 SPLH is likely more efficiently staffed than one at £35, regardless of how much total revenue either one is doing. Raw revenue or covers alone won’t tell you that, you need the ratio.
Ranking sites: know where to look first
Ranking is the natural next step from comparison – surfacing your best and worst performers on a given KPI so you know where to intervene first, and where to steal ideas from for everyone else. One nine-site group used exactly this approach to chase down a gross profit gap between two similar sites. A side-by-side comparison of sales mix and pricing found a 6% discrepancy – fixing it could recover 3–4% of GP within weeks.
This is where restaurant KPIs stop being single-site housekeeping and start earning their keep as a genuine management tool. A 20-site group and a 1-site restaurant are both tracking food cost % – but only one of them needs to know which site is dragging the average down.
How often should you review each KPI?
Not every restaurant KPI needs daily attention. Checking net profit margin every morning is just noise – you won’t have moved the needle since yesterday. But wait a month to look at labour cost %, and the damage is already done and the rota’s already been paid out. Here’s a suggested cadence for each metric covered above.
| KPI | Cadence | Why |
|---|---|---|
| Net sales / sales vs. budget | Daily | Tenzo’s daily reporting guidance treats revenue vs. budget as core to same-day operational awareness – it’s the first number a GM should see each morning. |
| Covers / ATV / SPG | Daily, trended weekly | Daily to catch service-level issues, weekly to spot upselling or pricing trends worth acting on. |
| Labour cost % | Daily | Flash labour figures let you catch an overspend on Tuesday and fix Wednesday’s rota, rather than finding out at month-end. |
| Sales per labour hour | Weekly | Tenzo’s ‘optimise labour planning‘ dashboard is built to be reviewed weekly – zooming out on the past week’s schedule before building the next one. |
| Food cost % (COGS%) | Daily (estimated), weekly (actual) | Theoretical cost of goods can be estimated daily from your sales mix, but actual figures firm up on a weekly stock count cycle. |
| Actual vs. theoretical usage | Weekly | Tied to stock-take frequency – most operators reconcile this weekly rather than daily. |
| Gross profit % (GP%) | Weekly / period | Reviewed alongside food cost actuals once stock counts land. |
| Review scores | Daily (alerts), weekly (trend) | Negative reviews need same-day attention; the overall trend is more useful reviewed weekly. |
| Table turn / repeat rate | Weekly / period | These move slowly enough that daily tracking adds noise rather than insight. |
| Prime cost | Daily / weekly | Tenzo’s profit margins analysis is explicit that the most resilient operators track prime cost daily, not at month-end. |
| Net profit margin | Monthly (period) | Needs a full P&L to calculate properly, so it’s a period-end metric rather than a daily one. |
| EBITDA margin | Period / quarterly | Typically reviewed at group or investor-reporting cadence rather than unit level. |
The pattern holds across the board: sales and labour move fast enough to need daily eyes, cost-of-goods and guest metrics settle into a weekly rhythm, and true profitability metrics are period-end by nature – you can’t calculate net margin without a finished P&L. Daily reports are for operational awareness, weekly reports are for trends. Neither replaces the other, and reviewing every KPI on the same clock just means you’re either drowning in noise or missing problems until they’re expensive.
How to track restaurant KPIs – dashboards & automation
Knowing which KPIs matter is only half the job. The other half is tracking them without it eating someone’s whole week. Most operators land on one of three approaches.
- Spreadsheets are the natural starting point – free, flexible, and something every team already knows how to use. Tenzo’s own comparison of spreadsheet-based reporting is upfront about this: for a single-site operator, a spreadsheet may genuinely cover everything you need. Where it breaks down is scale – manual data entry from GMs, version-control chaos across multiple sheets, and reports that are already stale by the time they’re finished.
- Traditional BI tools like Power BI, Looker, or Tableau solve the aggregation problem but introduce a different one: they’re built for analysts, not for a GM checking KPIs between services. They tend to be desktop-first rather than mobile-friendly, and the granularity head office wants is often more than a site-level manager needs day to day.
- Purpose-built restaurant analytics platforms sit in between – designed specifically to pull POS, labour, and inventory data into one place without a dedicated analyst to maintain it. Tenzo’s KPI dashboard guide makes the case that the dashboard itself is only half the job – the other half is tailoring what each role sees, since a business director and a GM need very different views of the same underlying data.
Whichever route you take, the same principle holds regardless of provider: track fewer KPIs more frequently rather than more KPIs less often, and make sure the automation actually gets the right number in front of the right person. A beautifully built dashboard nobody opens isn’t tracking anything. Tenzo’s restaurant analytics product is one option built specifically around that principle, if you want to see what purpose-built KPI tracking looks like in practice.
Conclusion
Tracking top restaurant KPIs isn’t about drowning in data – it’s about watching a small, consistent set of numbers closely enough to catch problems while they’re still small. Sales and labour move fast enough to need daily eyes. Food cost and guest experience settle into a weekly rhythm. True profitability metrics like net margin only make sense once the period closes. Get that cadence right, and you’re no longer waiting for month-end to find out something went wrong.
The harder part for most operators isn’t knowing which KPIs matter – it’s getting them out of five different systems and in front of the right person before the numbers go stale. That’s the gap purpose-built restaurant analytics platforms are built to close.
If you want to see what that looks like with your own data – prime cost tracked daily, sites benchmarked against each other automatically, reports that land before your first coffee – book a demo with Tenzo.
FAQ
Frequently Asked Questions
Prime cost (labour cost % + food cost %), net sales, food cost %, labour cost %, and average transaction value form the core set — and each one drives profit in a different way. Prime cost is the fastest read on overall health, since it captures your two biggest controllable costs in one number. Net sales tells you whether the top line is moving in the right direction at all. Food cost % and labour cost % isolate exactly where margin is being won or lost, so you know which lever to pull. Average transaction value shows whether you’re extracting more value per visit – often the cheapest way to grow revenue, since it doesn’t require a single extra customer through the door.
Food cost % = (Cost of goods sold ÷ Food sales) × 100. So if a dish’s ingredients cost £3.50 and it sells for £12, that’s (3.50 ÷ 12) × 100 = 29.2% – comfortably inside the standard 28–32% range most UK restaurants target. Run this at the menu level, not just the whole-business level: a single dish sitting at 40% can quietly drag your average up even while most of the menu is healthy.
Typically 25–35% of sales, with the exact target driven by service format: UK full-service restaurants generally sit at 28–35% of revenue, while quick-service formats run leaner at 25–30%. The main drivers behind where you land in that range are service model (a tasting-menu restaurant needs more hands per cover than a fast-casual counter), average spend per head, and how tightly scheduling is matched to actual demand rather than a fixed rota. A lower percentage isn’t automatically better – a site running at 28% with declining review scores may simply be running too lean.
The same core KPIs as a single site – but consolidated into a group-level roll-up and compared site to site, with outlier flags rather than a manual scan across separate reports. The most effective multi-site setups don’t just aggregate the numbers; they flag automatically when a site drifts meaningfully from the group average on labour, food cost, or sales, so underperformance surfaces on its own instead of waiting to be spotted.
A metric is any number you can measure. A KPI is a metric tied to a specific goal. Net sales is a metric; net sales against this week’s forecast is a KPI, because it tells you whether you’re on track and what to do if you’re not.

See your KPIs tracked automatically, across every site.
Real-time analytics in the views you want.