Supercharge Restaurant Success with a Powerful KPI Dashboard
Are you looking to supercharge your restaurant’s success?
To make data-driven decisions that can drive growth and profitability, it’s crucial to have access to the right information.
In this article, we will explore the concept of a Restaurant KPI Dashboard and how it can help you track key performance indicators in a restaurant analytics tool like Tenzo, to make informed decisions.
To effectively boost restaurant performance, my customers have felt that the most important metrics to be monitoring are ATV, Guest Count and Sales Comparisons compared to last week or last year and so on. – Maria Gully, Customer Success Manager at Tenzo
– ATV or SPG (which one they use depends on each restaurant/POS) – Guest count or Transaction count (same as above) – Sales comparison (to last week, last year, etc)
What is meant by a Restaurant KPI Dashboard
A restaurant KPI dashboard is a tool that provides a visual representation of key performance indicators (KPIs) specific to your restaurant. It provides an opportunity to effectively communicate a business’s KPI progress to its stakeholders.
Unlike traditional reporting methods, a KPI dashboard allows restaurant owners and managers to easily track and monitor important metrics in real time. It provides a comprehensive view of the restaurant’s performance, allowing for data-driven decision-making and the ability to quickly identify areas of improvement.
Best KPIs to include in Restaurant Dashboards
When it comes to restaurant dashboards, there are several KPIs that are essential to monitor to boost restaurant success.
These KPIs can be in-line with sales, labour, or inventory aspects of restaurant businesses. By tracking these metrics, restaurant owners and managers can gain valuable insights into the financial health of the business, optimise labour costs, and ensure efficient inventory management.
Sales
Sales KPIs are crucial for measuring the financial performance of a restaurant. These are likely to be the most useful metrics for monitoring the success of the business and will impact how revenue is spent.
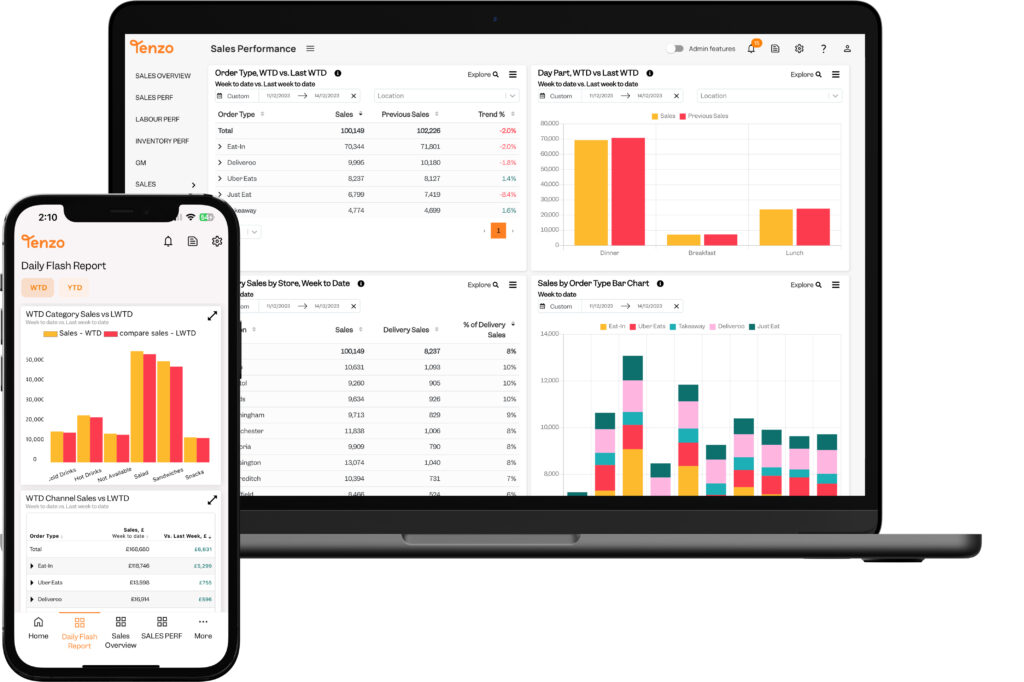
At Tenzo, we feel the most useful metrics to monitor on your dashboard when tracking sales performance are:
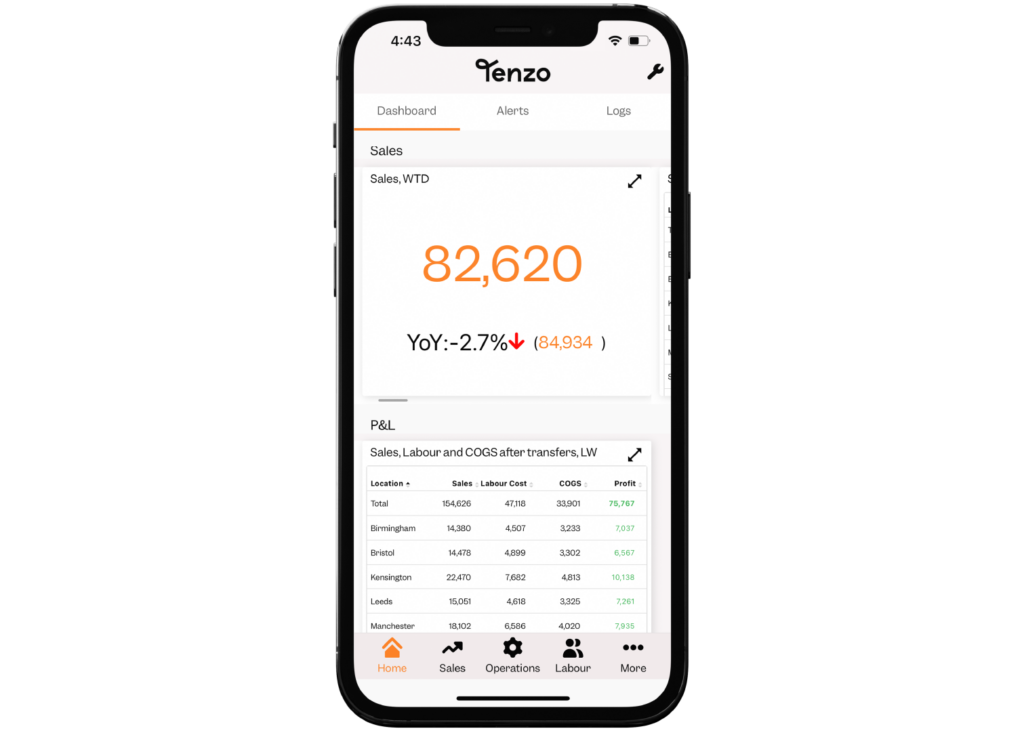
- Sales Week-To-Date compared with Last Week-to-Date
- Sales vs. Budget by Day
- Transactions Last four weeks compared with Last Year
- ATV Last four weeks compared with Last Year
- ATV by Employee
Tracking your sales compared to last week, and how sales compare to budget gives restaurants an immediate evaluation of whether the restaurant’s performance is improving. Ensuring the sales are hitting the budget allows operators to know that their costs are covered by revenue.
Monitoring ATV and Transactions over the last four weeks, and ATV per employee helps restaurants understand whether changes in sales are coming from more customers or more transactions. This helps target sales and marketing strategies.
Labour
To boost your restaurant’s performance, it’s crucial to monitor key performance indicators (KPIs) related to labour.
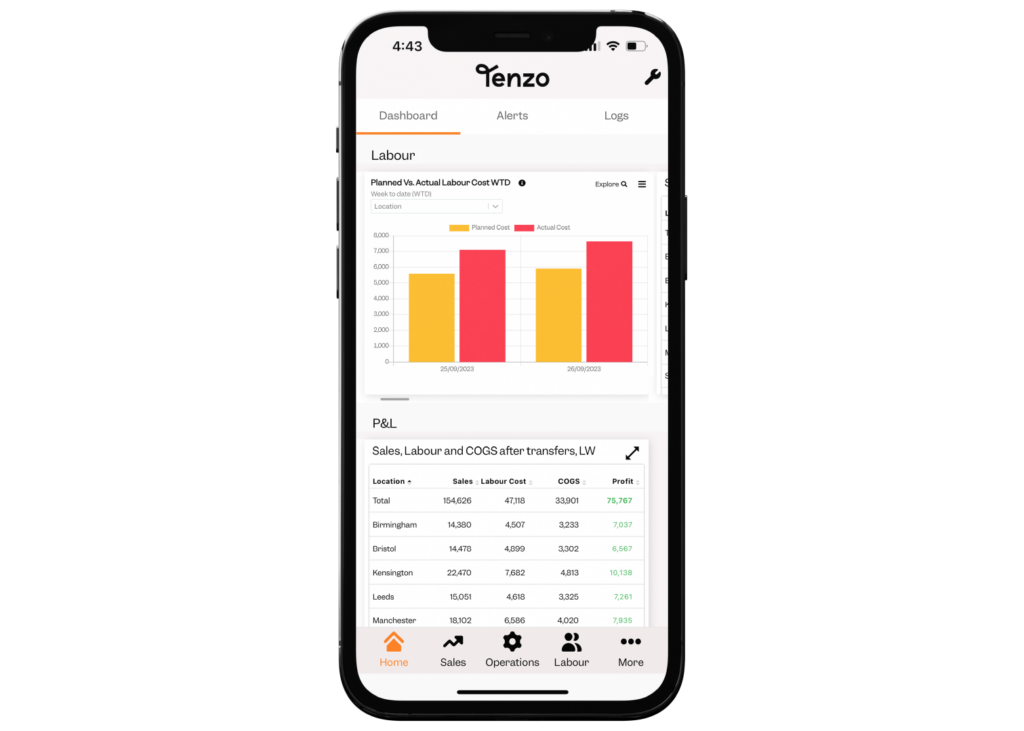
We believe that some of the most important KPIs to monitor on a restaurant’s dashboard for labour performance are:
- Cost of Labour as a percentage of sales by location and day of the week
- Planned vs. Actual labour Cost
- Labour Percentage by Day of the Week
- Average Sales vs Actual Labour Cost by day
- Sales vs. Labour Mix
- Sales & Forecast vs. Actual & Planned Labour
Monitoring the cost of labour as a percentage of sales allows restaurateurs to ensure that labour costs are in line with revenue and make adjustments accordingly. This, alongside the Sales vs. Labour Mix, helps to track labour productivity and ensure that labour processes are optimised. This also helps make sure staff aren’t overrun and at risk of burnout. Tracking this by the day of the week also ensures that productivity is maintained throughout the week and that profits can be maximised on fast and slow days.
Looking at planned hours and comparing these to actual hours worked, or the sales relating to those periods also helps to optimise labour costs. Planned hours are based on what restaurants have put into the labour tool, and this is likely from predicted sales for that period. Aiming to match the actual labour hours to these is likely to create stability for your team, and be able to predict revenue spend more accurately.
Inventory
Inventory KPIs are crucial for effective inventory management in a restaurant. By tracking these KPIs, restaurant owners and managers can minimise food spoilage and reduce inventory carrying costs; leading to a more sustainable industry.
The most effective metrics to track to optimise inventory management are:
- Theoretical Use, Actual Use, Wastage, and unaccounted for as a percentage of sales
- Sales, Cost of Labour, and Cost of Goods Sold after Transfers
- Wastage by Category
- Inventory Price Changes by Vendor
Waste is an incredibly important aspect of inventory for restaurants. Not only does it have environmental impacts but it can be a huge financial cost. Tracking wastage by location, and then by item, helps ensure everyone is using the correct processes and portioning as per the recipes.
Inventory price changes are important to monitor especially for restaurants that use multiple suppliers for the same items. With the current rates of inflation, prices are changing all the time, but at different rates for different suppliers. Tracking this helps restaurants get the best price for all their items, as well as leveraging quality.
Restaurant KPI Dashboards for Specific Roles
It is important to tailor the restaurant KPI dashboard to specific roles within the restaurant, such as business directors, general managers, and chefs. Each role has different goals and responsibilities, and their dashboard should reflect the metrics that are most relevant to their role so that they can maximise the insights gained.
Business Directors
Business directors in restaurants are responsible for the overall success of the business. Generally, there will be roles within the directors that are responsible for the overall financial performance of the business and expansion, as well as all operations and people within the business.
Their goals may include increasing revenue, improving profitability, and managing costs. The metrics they focus on provide insights into the financial health of the business as a whole and help guide strategic decision-making, whilst taking into account the front-line operations.
We believe that the most important KPIs for business directors to focus on are both high-level and more granular. It’s important to know what is going well in a zoomed-out view with a Flash P&L: incorporating all factors of COGS, labour and sales, to determine how much profit the restaurant is making.
Senior stakeholders need to be able to go more granular quite quickly to understand where the improvements, or mistakes, are being made. For example, labour spend could look positive over the month, but in reality, it equated to overspending at the beginning and having to reduce spend to remain within budget towards the end.
When diving further into their data, for COGS and inventory, labour productivity and wastage should be focused on. For multi-site operators, it’s important to have granular information on individual locations as well as overall contributing factors.
General Managers
General managers play a crucial role in overseeing the day-to-day operations of a restaurant. They are responsible for managing staff, ensuring customer satisfaction, and meeting financial targets.
The KPIs that would most help general managers will identify areas for improvement, optimise staffing levels, and ensure a positive dining experience for customers.
Empowering general managers to use their data is vital. Normally, time restraints mean that they don’t have time to be diving into spreadsheets throughout the day. However, creating a dashboard focused on information important to them and making it easily digestible allows them to use their data in real time.
Tenzo believes that quick data values for their specific locations such as ATV, Number of Transactions, Labour Cost Percentage, and Recent Social Reviews are the most important. It’s valuable to compare this weekly so that recent changes in operations or staffing can be evaluated easily.
Conclusion
In conclusion, using a restaurant KPI dashboard can supercharge performance. It allows you to track key metrics and make data-driven decisions.
Focusing on KPIs from all areas of the business; sales, labour, and inventory, is vital to create a sustainable business and maximise profitability.
A KPI dashboard within a restaurant analytics tool provides valuable insights and empowers restaurant owners and managers to make informed data-driven decisions that promote success.