
How does Tenzo compare to a data warehousing and visualisation reporting process?

In this article
So we’ve covered how Tenzo compares to a spreadsheet-based reporting process, but what about more advanced data warehousing and visualisation processes?
When it comes to sophisticated reporting setups, we often see operators default to data visualisation tools like Power BI, Tableau or Looker.
These tools are incredibly powerful in many industries but the setup process can be very painful and their benefits are not always suited to F&B applications.
Here we’ll break down how Tenzo and data visualisation and warehousing platforms compare and the pros and cons of each.
The benefits of data warehousing and visualisation
In a perfect world, there are some great benefits to building your own reporting process with a data warehousing and visualisation solution.
Automate the weekly spreadsheet
You eliminate the manual work behind a weekly report done by head office. By bringing your data into a data warehouse, you can query it and create very advanced visualisations unique to your business.
Customisable
Because you are in charge of your own data setup, you can visualise anything as long as you have the data (and skill) to do it.
Advanced
Using these tools can promote your business as technologically advanced and potentially allow you to make further technological innovations.
However, unfortunately, we’re not in a perfect world and we’ve seen what can seem like a simple project from the outside implode once it gets going: trying to connect too many data sources so mismatches abound, there isn’t the expertise in-house to build the reports, it’s hard to get data out of systems which may or may not have an API or a way to send data sensibly by email, and the list goes on…
The challenges with data warehousing and visualisation
Set up
Before we can get started on the visualisation side of things, businesses wanting to use these tools will need to set up a data warehouse. And that is certainly not simple.
To get started, you’ll need all your tech suppliers to provide you with an API (assuming they have one). You’ll then need to connect the APIs to a data warehouse. This step usually requires a cloud engineer to complete.
The next step is to ETL your data (extract, transform and load) to be able to query it. This step usually requires a data engineer.
Finally, you’ll need to connect the data to a visualisation tool.
Although these three steps seem simple enough, they are anything but. Aside from the actual connecting of sources, you’ll need to consider how to ensure data reliability, data security, and access. We’ve seen the set-up of these projects take years and cost hundreds of thousands of pounds.
Ongoing challenges
Even if this setup process is completed, the issues (and costs) can continue to mount.
Slow data loading
Because there is little speed optimisation built into this setup, the time it takes for reports to load can be prohibitively long. This is even worse if the data is unstructured in a data lake.
Difficult to alter
Once you’ve set this process up, you’re locked into your operational systems like POS, labour and inventory, unless you want to go through the whole exercise all over again. While you may be happy with them now, who’s to say they won’t be obsolete in the next three years? Then all the work is moot.
Too complex for frontline
The people on the ground, who are making business-altering decisions day in and day out, don’t have the time or expertise to engage with data visualisation tools. Plus, teams have different understandings of what the data means so what finance might think is important, might be applicable to what ops need. Then ops can’t dive into the data and go deeper to understand how all the numbers affect them in their restaurant. So it gets ignored.
No quality assurance
Problems happen and data mismatches. If that happens with a custom-built data visualisation platform, you’re on the hook for figuring out what’s gone wrong. There’s no one preemptively checking to make sure all the data matches and solving issues as they arise. Worse, if you don’t notice the issue decisions are made based on incorrect data.
Expensive
Set-up is expensive but is only a fraction of the maintenance costs of a system like this.
No forecasting
To benefit from AI-based demand forecasting, you’ll need to add another prediction layer on top of your visualisation layer, adding to the complexities of the project.
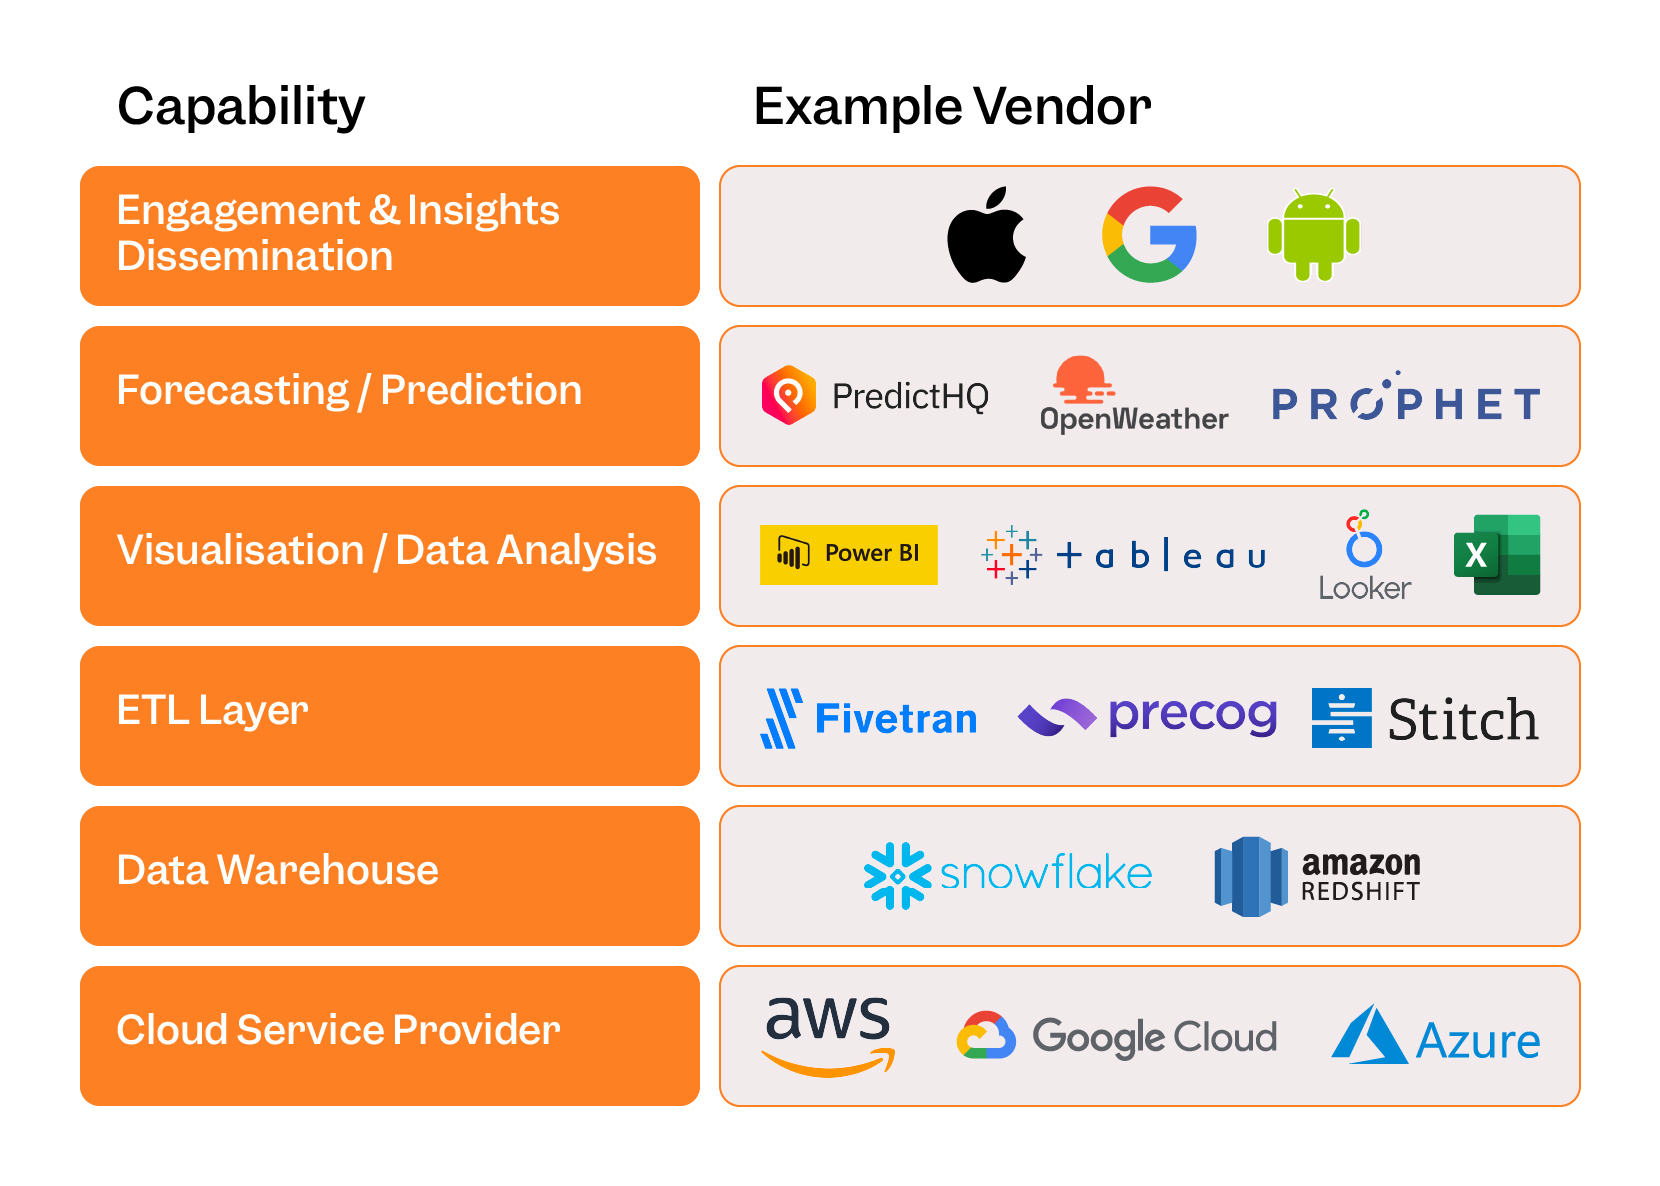
Here’s an example of all the tools you’ll need in order to get the build right:
On the other side, you’ve got Restaurant PerformanceOps tools like Tenzo.
Because we solely cater to hospitality, we know that the challenges operators face are unique to other industries.
Fundamentally, the people making business-impacting decisions are the ones running the restaurants. Therefore, we believe that empowering these frontline workers, not just head office, with data improves business performance.
Benefits of a Tenzo-based reporting process
Reliable data
We maintain all our integrations so we know the moment something doesn’t look right. Beyond manual QA, we use Airflow to ETL our data which will automatically keep retrying to import if anything fails. This allows us to provide users with highly reliable data in near real-time so decision-making can be done with trust.
Accelerated performance
We maintain several types of databases so that we can optimise the query process leading to fast results. In simple terms, this means Tenzo’s reports load very quickly and you get answers instead of frustration waiting for data to load.
Flexibility
We have very robust normalisation techniques involving the transformation of all imported data into a unified Tenzo schema so no matter what sources you connect, reports will be consistent. This has the added benefit of providing flexibility in your tooling: if you decide to switch to another POS, your historical trend reports will continue as normal in Tenzo.
Levels of access
While head office users may want to see the business performance as a whole, sensitive data may not be appropriate for all users. Tenzo has a very intuitive permissions framework that allows you to group users and decide who should see what. That way everything is always relevant to the person viewing the data.
Report discovery
Tenzo has built-in report discovery in the platform. Experiment with what metrics and KPIs could be added to your business with the knowledge that these reports are backed by collective decades of hospitality experience.
Visibility
Automated emails keep you up to date with what is happening in your business every day. Our users rave about the morning email that shows yesterday’s sales, costs and the context behind them. Plus, benefit from an alerts framework that notifies you when something doesn’t look quite right.
Not just the past, but the future too
AI has been the buzzword on everyone’s lips, but it is very useful when it comes to predicting patterns. Thanks to our unified schema, our AI algorithms have structured data to learn from, not to mention the additional layers of data that we add (weather, events, holidays, etc…) That means that demand forecasts can be as accurate as possible to help with efficient staffing and ordering.
Context
Quantitative data is great, but without its qualitative context, it can be hard to understand why certain things are showing in the data. Our logbooks allow users to fill in daily reports right in the app so the numbers and their context are right there in one place.
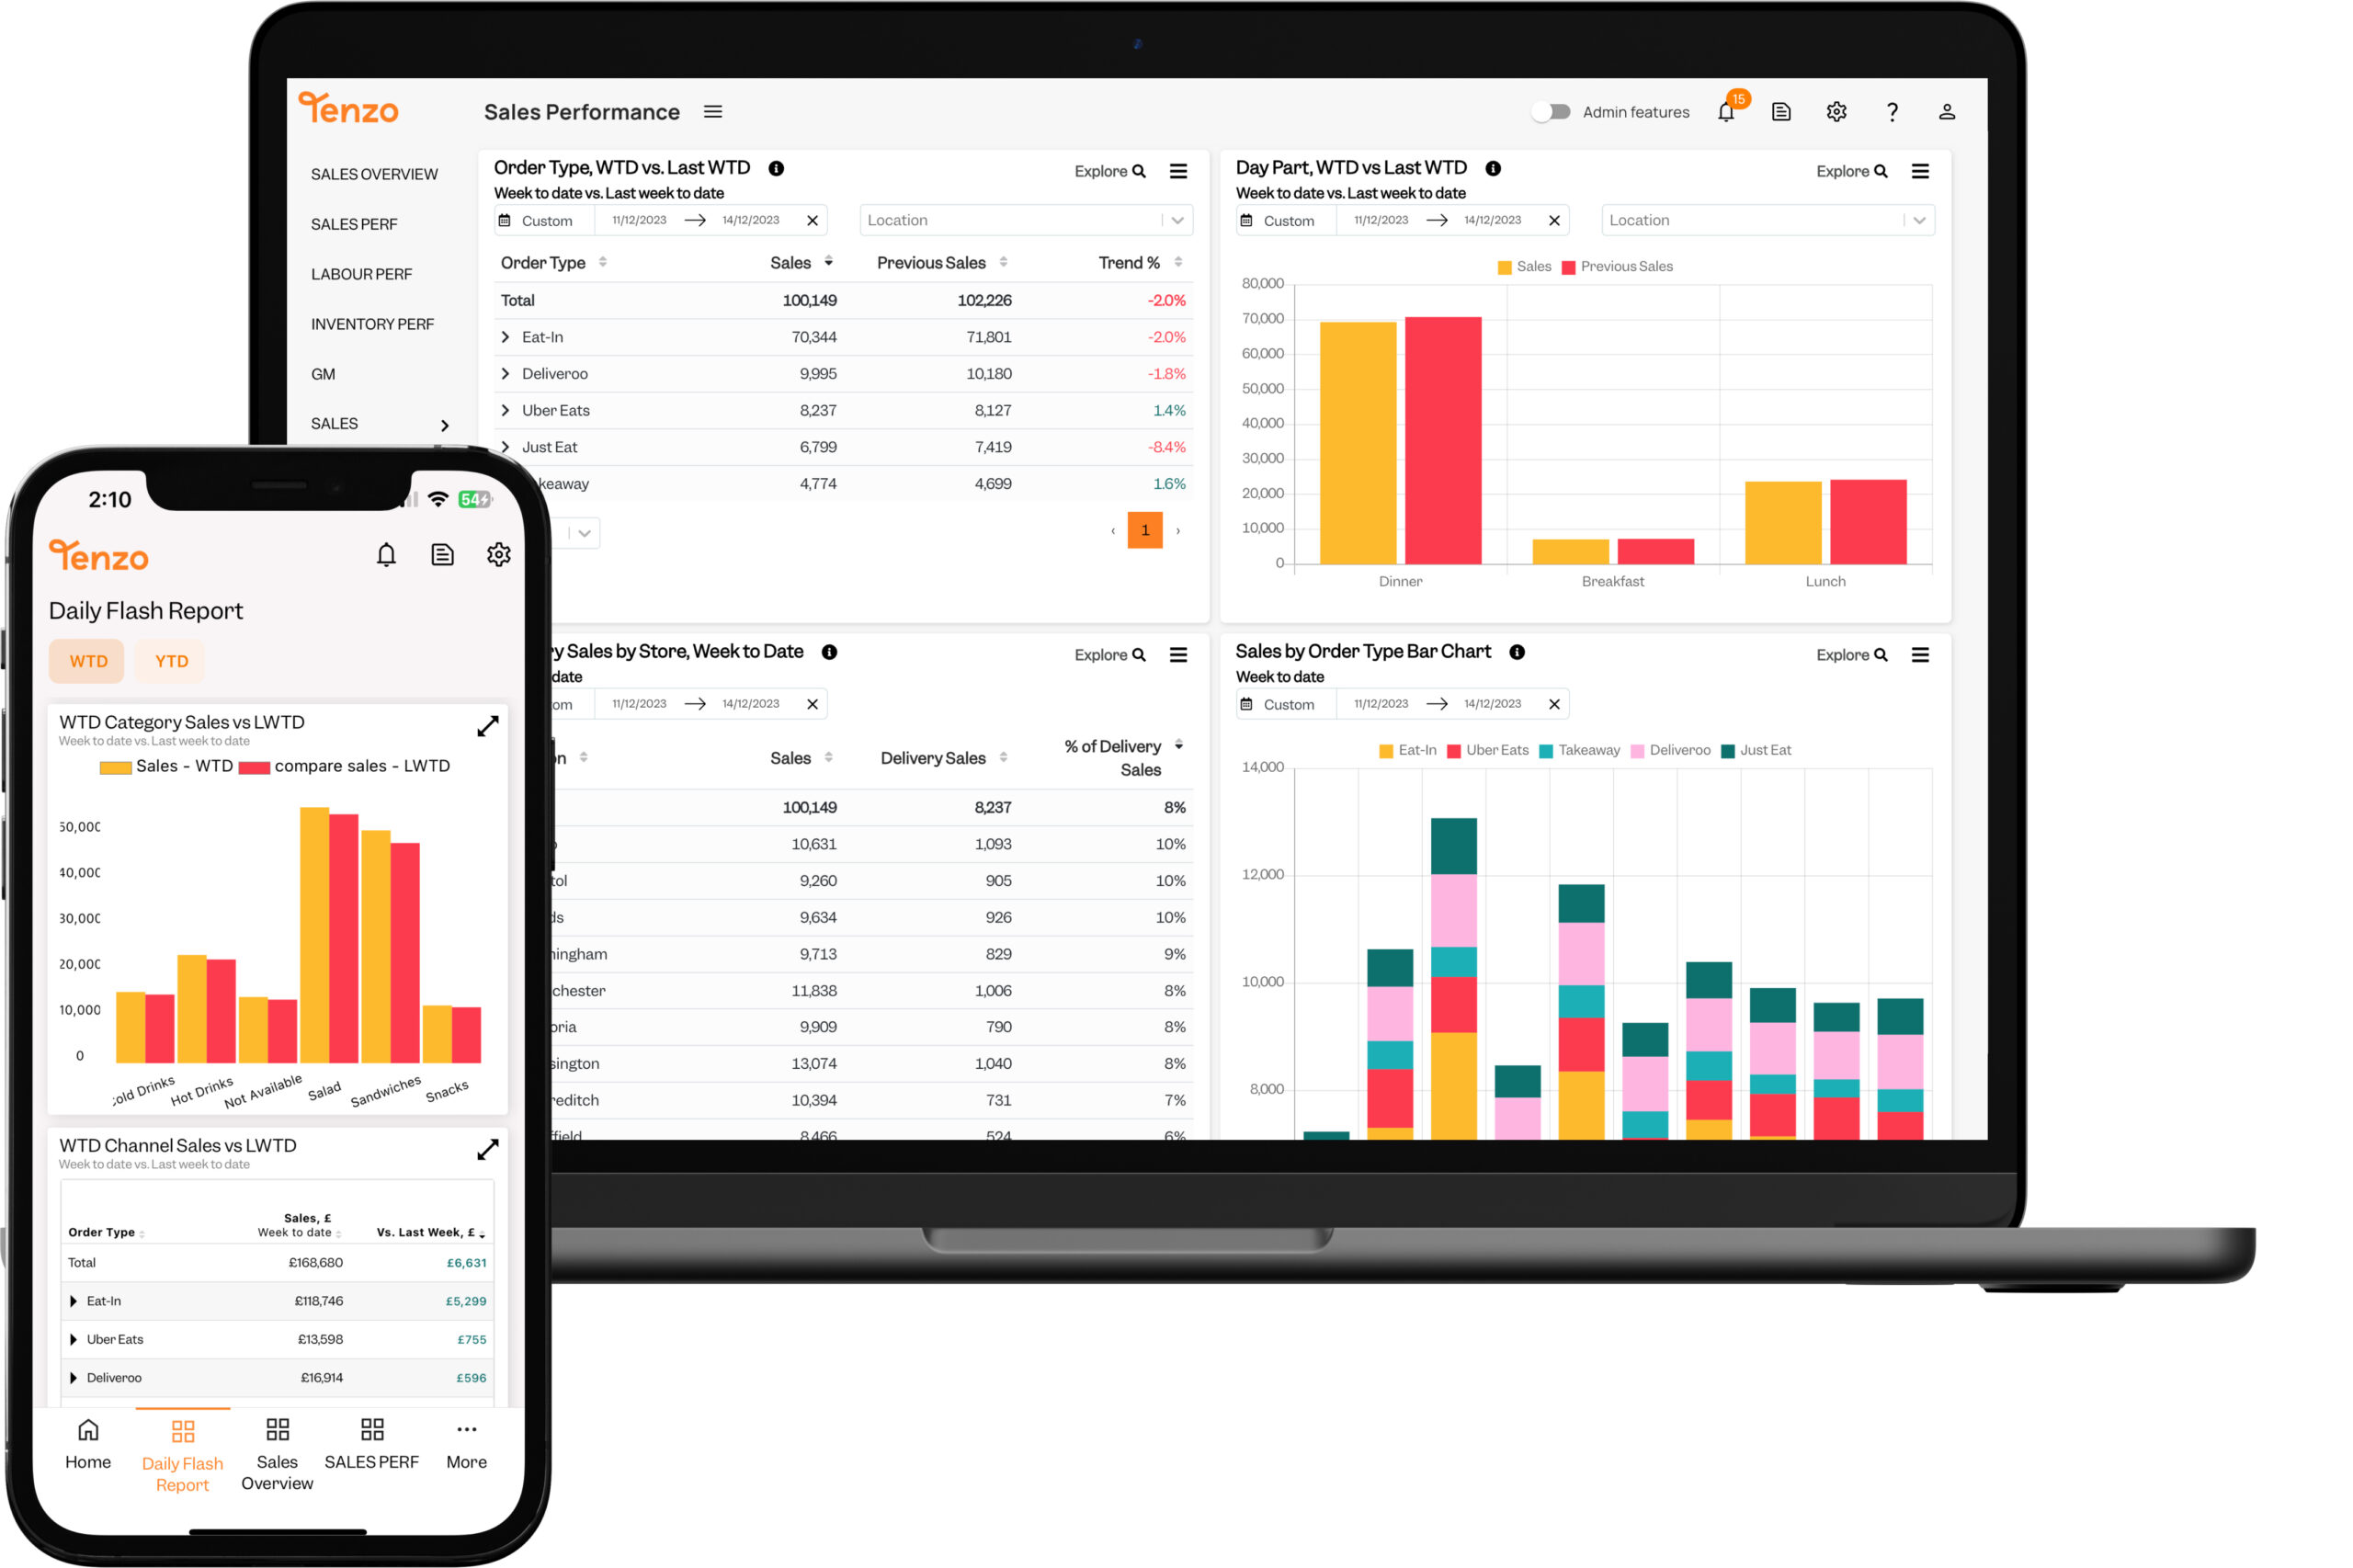
On the go
Restaurateurs are not always sat behind a desk, so Tenzo goes where you go. Our native mobile apps allow users to gain insight wherever and whenever they want.
Hospitality to the core
Tenzo was built by restaurateurs for restaurateurs. We only serve the hospitality industry so we understand the challenges faced by operators on a daily basis. We know what reports and insights are key in this business.
Although data visualisation tools can be effective at a head office level, it’s getting the operators on the frontline to engage with data when making decisions that we believe really makes an impact on performance.
Get in touch if you’d like to find out more about how Tenzo could improve your business’s performance!
Looking to find out more?
We broke down all the ways you can approach your data strategy in your restaurant in our helpful buying guide.