Lessons Learned from Airflow 2.0

Apache Airflow is an open source platform to run tasks, designed to be scalable and performant, featuring a modern and robust UI. We transitioned to using Airflow in order to upgrade our existing task infrastructure, improving the rate and volume of data that we can process, and to increase reliability.
We’ve incorporated Airflow in our processes for about six months now, and have reached the point of a stable release. Airflow is primarily used to run tasks in our Extract, Transform and Load (ETL) pipeline, and is currently running thousands of tasks per hour – a figure that will continue to grow as we add even more tasks (like forecasting).
With that in mind, we wanted to share some of the obstacles we’ve faced specifically in the transition to Airflow 2.0, and how, by using Airflow’s built-in tools, we quickly identified issues, and were able to solve them. In a bid to help anyone in a similar position, we’ve put together this blog to cover:
- Using Landing Times to identify problems
- Improving DAG File processing time
- Smoothing schedules to distribute load
- Decreasing task cleanup time
- Fixing Github issues
- Provisioning worker resources
A big thanks to the Airflow development community for all their hard work – joining the Airflow Slack as well as searching Github Issues can be great ways to get answers, and we’ll definitely be leaning on these resources as much as possible in the future.
Use Landing Times to identify problems
One of the benefits of using Airflow is the ability to interrogate various aspects of tasks – whether that’s checking the logs, inspecting the various charts available, or looking at errors. A DAG’s Landing Times chart shows the delay from task scheduling until completion, and can be tracked over time to evaluate the effectiveness of changes. It builds a picture of what was happening, giving us the insight needed to begin troubleshooting.
A number of tasks that were expected to only take a few seconds to run were taking well over an hour to complete. This not only gave us visibility of the problem, it also gave us a measurable metric to try and reduce. We set the goal of getting sub 10 minute runs.
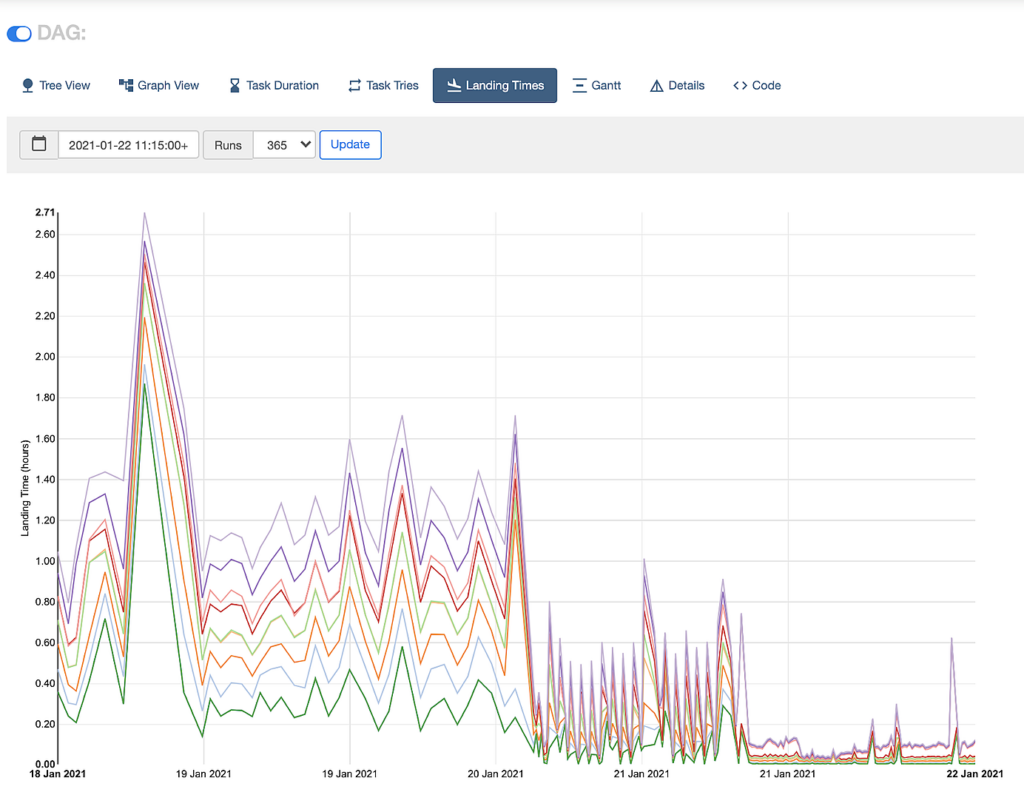
Prior to 20 Jan 2021, tasks were taking upwards of one hour to complete. After some improvements, we reduced this to around 30 minutes, and after further improvements we had this below 10 minutes. This was all enabled by Airflow 2.0
Improve DAG File processing time
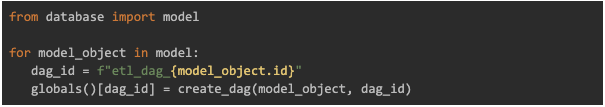
We create a large number of our DAGs dynamically based on the existence of certain objects in our database.
Our initial solution, which worked for a time, involved fetching these models from the database directly as part of the DAG file, and generating the necessary DAGs from each object. Something similar to this:
We began to suspect this may be causing slowdown after seeing a number of “DAG Import timeout errors” (both in the UI and in the logs). This brings us to an important point about DAG file definitions: Airflow will import these files in many places, and expects them to take 1 or 2 seconds at the most to process. Any longer and various services will be affected:
- the Scheduler will slow down the scheduling of tasks,
- the workers will slow down their execution of tasks (because they import the “DagBag”, which involves importing these files, and the processing of these DAG files can occur multiple times every second).
As such, creating database connections should be avoided in the DAG file definition (it’s absolutely fine within the actual task that gets executed – just not in the DAG file itself, where you are defining the Operators and the relations between them).
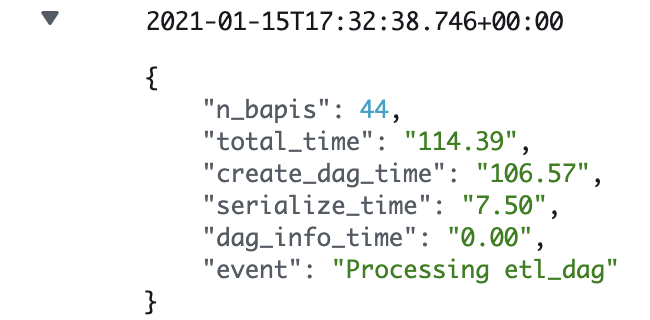
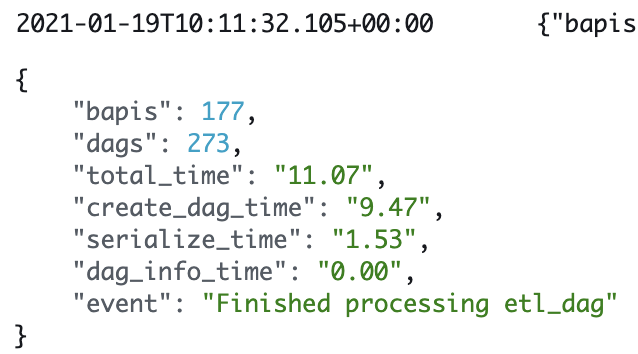
To gain some clarity we added some logging to our DAG file and got some fairly shocking results (at this point we had set dagbag_import_timeout to 120 seconds, meaning any imports taking longer than that would fail). While they would sometimes process quickly, the amount of time to process the DAG file would easily surpass 120 seconds if it could.
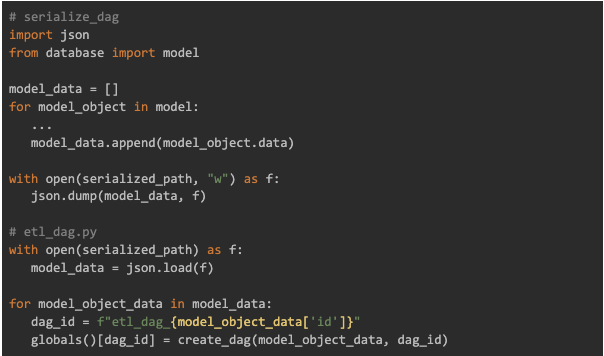
Our current solution is to serialise the model data to a json file that every service has access to. A specific DAG runs periodically to enable this, meaning it’s the only DAG that actually accesses the database. Our original etl_dag now reads that file, and generates the DAGs from that data.
While there is definitely more that can be done here – we still see the occasional timeout, and as the file is being read from a remote location it can run into issues – the time it takes to process the DAG has been significantly reduced, which in turn has helped reduce the individual task runtime.
Smooth schedules to distribute load
Our DAGs run on a variety of schedules – some run every hour, some run daily, and others somewhere in between. Airflow makes it easy to set the run schedule using cron presets such as hourly and daily, which initially met our needs.
However, after adding more and more DAGs, we found that there would be spikes at the start of the hour, where everything tried to run at once, and quiet periods at the end of the hour where almost nothing ran. This meant that our workers, which process tasks, were running at 100% for the first 15 minutes of the hour, then sitting idle for most of the rest of it.
Thanks to Airflow’s metrics, some of which were pushed to Cloudwatch on Amazon Web Services (AWS), we gained visibility on how our tasks were behaving over time. We noticed these hourly spikes, which compounded when various tasks ran daily (some at midnight, some at 4am). This was regularly causing a build up of tasks in the queue.
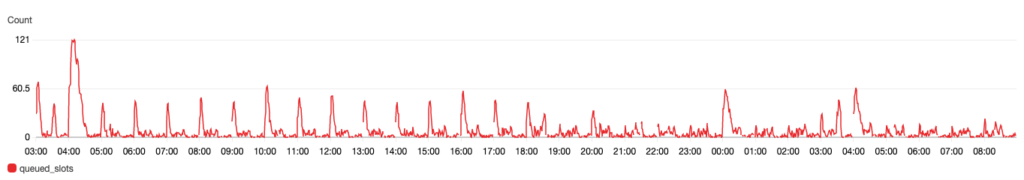
Hourly spikes, combined with daily tasks, led to unnecessarily long landing times. Staggering these tasks across the hour helped spread the workload.
Our solution was to spread the schedules across the time period. So for hourly DAGs, instead of running all of them on the hour (e.g. 15:00), they were staggered across the hour (so the first DAG would run at 15:00, the second at 15:02, the third at 15:04, and so on). There was an immediate reduction in these spikes, and a more even spread of workload on our workers. The fewer spikes, the fewer workers needed to handle the same number of tasks. This meant reduced cost, as well as reduced landing times.
Decrease task cleanup time
Celery Executor allows us to scale the number of workers depending on the number of tasks waiting to execute. Another benefit of using Celery is having access to Flower, a UI for inspecting the individual workers and how they’re performing.
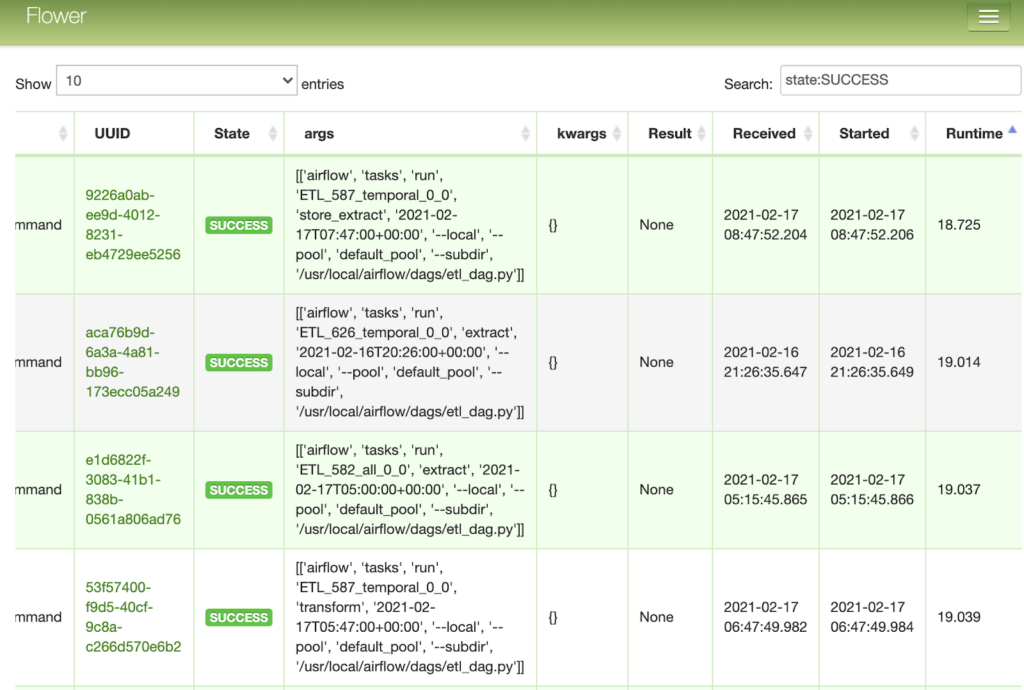
Many tasks should have been fast, completing in 1 or 2 seconds, and within the Airflow UI this appeared to be the case. But by inspecting the tasks in flower, it showed that many of these short tasks ran for over a minute.
Improving DAG file processing time helped reduce this, but by reviewing the logs we discovered that tasks were hanging for up to 60 seconds after completion.
After some experimentation with the Airflow configuration file, we landed on reducing the killed_task_cleanup_time option. Tasks continued to finish normally, and the hang time was significantly reduced.
Apply fixes from Github issues
After the Airflow 2.0 release, it was useful to look at Github issues in the milestones for the next minor release (2.0.1 at the time). With so many moving parts, it was important to narrow down the source of the problem to help distinguish between issues in our code and our configuration, and issues in airflow code.
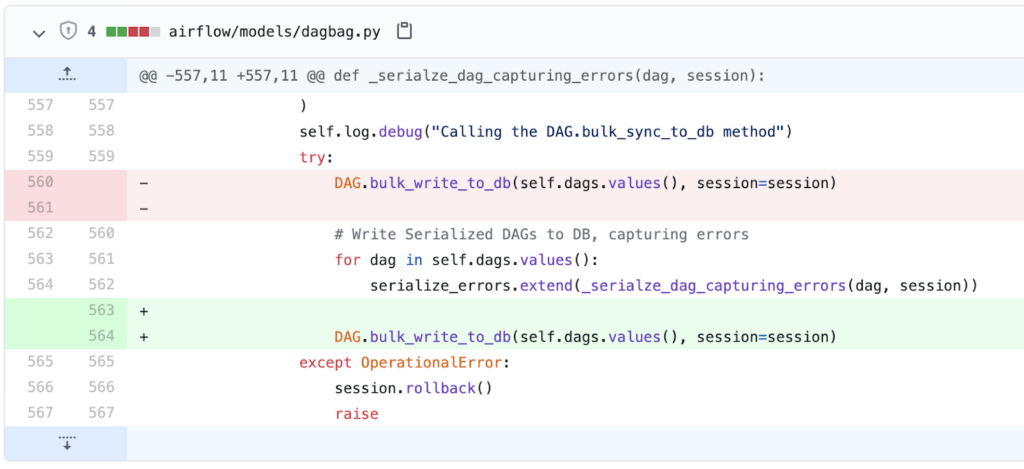
Critical issues that only required a minor code change could easily be patched now rather than waiting on the next Airflow release. One such issue was “Fix race condition when using Dynamic DAGs”. The main part of the fix was essentially a one line code change.

Provision worker resources
Our workers run on AWS using Fargate containers. This allows us to easily scale up or down the number of workers, depending on the number of tasks we’re expecting to process. This also allows us to inspect certain metrics on the workers themselves, including CPU usage.
While developing our Airflow deployment, there were a number of configuration options to set and tweak to suit the needs of our tasks. One such option for celery workers is worker_concurrency. This defines the maximum number of tasks a worker will run simultaneously and will vary depending on the CPU and Memory available to the worker, and the nature of the tasks. Heavily CPU bound tasks will likely require a worker concurrency close to the number of CPU cores available (see celery docs), whereas tasks which are I/O bound can afford a higher value.
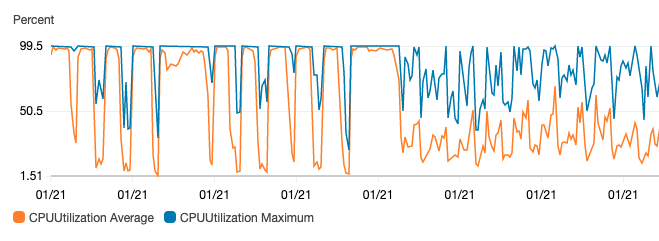
Monitoring the CPU usage of our workers through Cloudwatch, we found that they were maxed out almost all of the time. There are a few solutions to this including:
- adding additional workers
- sizing up each individual worker (add CPU to the worker)
- reducing the worker_concurrency value
Provisioning our workers and worker concurrency properly helped reduce stuttering of tasks (not enough CPU available so they wouldn’t process efficiently), and tasks failing to start (competing for resources, so processes failed to start).
Conclusion
By using Airflow, and upgrading to the 2.0 release, we benefited from:
- Scheduler improvements, allowing us to process thousands of tasks per hour. We then identified and addressed bottlenecks to speed up our pipeline,
- Added fault tolerance by adding redundancy and the ability to easily inspect individual tasks and fix issues,
- Faster development time. The ability to quickly identify and fix issues meant our development cycles became much shorter, meaning we could fix an issue within minutes of encountering it.
For our customers this means more reliable data streams and more frequent updates allowing near real-time data.
Looking ahead, we’ll be focusing on transitioning more tasks to use Airflow, starting with forecasting, and continuing to improve our pipeline, using task duration charts to identify bottlenecks.
You may also like