Top 6 metrics to boost sales and grow your business

Restaurants performance is threatened by several challenges. With lower customer numbers and increased costs due to inflation and supply chain issues, going from surviving to thriving relies on understanding data and good operational strategies.
The restaurateurs and operators that are most likely to outperform their competitors are those that are looking into their data regularly and identifying where improvements can be made within their business and using real-time data to boost performance.
For enterprise businesses, the three most important metrics to monitor to boost performance are; Guest Experience Rating, Sales Growth, and Labour as a Percentage of Sales” – Sam Benson, Enterprise Implementation Consultant at Tenzo
Top KPIs to improve restaurant performance and why
Metric 1: Gross Profit
Profit margins are incredibly tight for restaurants at about 2-6%; ensuring this is consistent is vital in improving restaurant performance.
Gross profit can be defined as the difference between revenue and the cost of goods sold (COGS). Or put another way, it’s the difference between the revenue of a menu item and the cost of the ingredients used to produce it.

Gross profit is an indication of how efficiently a restaurant is being run. In order to boost gross profit, you can drive revenue or reduce COGS.
There are several methods to reduce COGS, but implementing good inventory management strategies and standardising recipes is a good place to start.
Flash profit is a similar performance metric, but it incorporates labour costs too.

Flash profits can help multi-location businesses get good visibility of how different sites are performing against each other; helping teams gain insights on how to improve their performance by learning from others.
Metric 2: Average Transaction Value
Average Transaction Value (ATV) is the average transaction spent by individuals or groups at a restaurant or other hospitality business.
It can be calculated by dividing the total sales by the number of transactions, or by using POS tools that will report this metric.
Monitoring ATV in real-time is crucial to supercharge restaurant performance – increasing this number will have a meaningful impact on the bottom line. Knowing your position week-on-week (WoW) or year-on-year (YoY) helps to build an understanding of how business decisions have altered overall performance.
Upselling is the easiest way to increase ATV, and encouraging staff to upsell and monitor this in real-time is a better return on investment than acquiring new customers.
Metric 3: Spend per Item
Tracking spend per customer can be challenging for hospitality businesses where covers, or the number of customers, aren’t tracked – such as bars or QSRs (Quick Service Restaurants)!
The ATV is being skewed by the number of customers per order, so for these businesses, tracking spend per item is the easiest way to benchmark performance. It can be calculated by dividing total sales by the number of items sold.

This includes all variants of menu items and it gives a benchmark to be able to upsell against – the same way as ATV. This allows for employees to be incentivised to upsell in the same way too; helping improve performance.
It can also help to gauge the success of marketing strategies by helping operators understand whether the best items are being pushed for upselling. To maximise the spend per item, they must support the speed of service too. For example, a cocktail uses more labour hours than drinks with double metrics, so the latter should be upsold more.
Metric 4: Actual vs Theoretical Usage
This metric is so important for restaurant performance: wastage can result in huge costs that massively reduce profit margins – as well as being unsustainable. It can be tracked at a business level and an individual item level, but regular stock takes are required for it to be accurate.
It can be calculated by looking at the difference between the theoretical usage, and what was actually used. The theoretical usage is the amount of inventory that should have been used, based on recipes, for the amount of sales made.
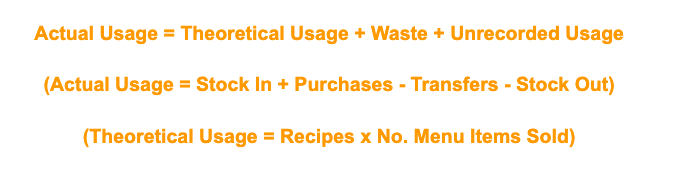
Measuring the variance of this is vital in controlling costs and reducing wastage. Looking at a restaurant’s position on this WoW and YoY is a great way to track changes in processes.
Tracking items at an individual item level helps to pinpoint the issues with the processes relating to them and make effective changes to boost performance. It’s crucial to identify whether the problems lie with spoilage or over-portioning.
Metric 5: Labour Productivity
Cost of labour (COL) is a huge outgoing cost for restaurants, so managing it efficiently is pivotal for a high-performing restaurant. At the current minimum wage (£10.42) saving one hour every day can save businesses £3,800 annually.
There are multiple ways this could be measured based on how the restaurant is run, and whether productivity is tracked on an individual employee basis, or company-wide.
Company-wide is best tracked by sales or covers per labour hour or as a labour cost percentage. Tracking these on a shift basis can help identify the best and worst-performing teams.
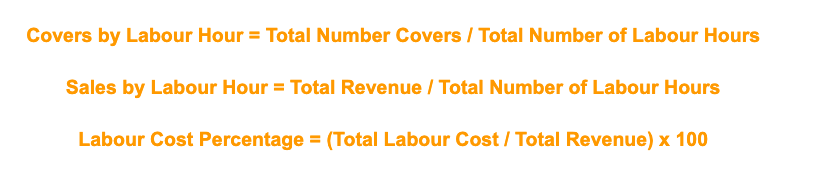
SPLH (Spend per Labour Hour) is one of the best ways to track productivity for individual employees. Company-led incentives can create healthy competition between the team to drive the overall revenue of the business.
Effective labour deployment can also impact labour productivity, but looking at it from all angles helps to control costs.
All stakeholders using the same data and working from one source of truth helps to encourage accountability and exposes struggles and internal challenges to work on. Correct communications following this can enhance performance by improving training.
Metric 6: Best-selling Menu Item
Getting deep menu knowledge can be really challenging. Often, restaurateurs’ or operators’ sense of the best-performing dishes is warped by their opinions and conversations with customers.
Monitoring the menu items for best selling (and worst) is essential to do consistently, with monthly or quarterly appraisals to reflect seasonal changes or varying marketing promotions.
Tracking this at a location level and the whole business is useful to gain a better understanding of customers. It’s likely some locations will have different customer personas due to external factors.
Knowing the best-selling menu items helps to menu plan effectively and optimise menus based on consumer preferences, and therefore, capitalising on popularity.
Strategically planning promotional items, and marketing strategies, by highlighting popular items will further drive revenue and business performance.
Conclusion
Improving restaurant performance is not something that happens overnight. It takes time to analyse and understand restaurant data to make data-led intelligent business decisions to drive growth and development.
The ease of aggregating and monitoring metrics, for operators and GMs to use, depends on the tech stack restaurants use. Different tech stacks will allow for different reporting, and therefore likely to have slightly different results.
The most important metrics can vary based on the type of restaurant. Ensuring that GMs understand their data, and how to use it, is imperative to making changes that supercharge restaurant performance.