How to Create COGS Trend Reports in Hospitality
In the fast-moving hospitality industry, costs are constantly shifting. Supplier prices change weekly, customer demand fluctuates daily, and waste can creep in unnoticed. For operators working with tight margins, it’s no longer enough to wait until the end of the month for a financial report. By then, the damage may already be done.
This is where real-time Cost of Goods Sold (COGS) trend reporting comes in. Instead of reviewing costs retrospectively, managers and department heads can track performance as it happens. That means quicker decisions, smarter purchasing, less waste, and—ultimately—greater profitability.
This blog breaks down how to build a real-time Cost of Goods Sold (COGS) trend report—from connecting your data sources to creating actionable dashboards and alerts—so you can reduce waste, react instantly to supplier changes, and keep every department accountable. Discover how to turn COGS reporting into the heartbeat of your operation.
Let’s walk through how to create an effective real-time COGS trend report, step by step.
Step 1: Understand What COGS Really Means
Cost of Goods Sold (COGS) refers to the direct costs of producing and delivering goods and services. The cost of goods sold includes the cost of ingredients, such as meat, vegetables, and spices.
The traditional formula is:
Cost of Goods Sold = (Opening Inventory Count quantity + Purchases quantity + Transfers In quantity – Transfers Out quantity – Closing Inventory Count quantity ) x item cost
For the COGS formula to be effective it requires constant monitoring. For instance:
- If you buy an extra case of wine this week but don’t sell it until next month, your COGS this week may look higher than expected.
- If waste isn’t properly tracked, your COGS will look better on paper than in reality—masking a problem that erodes profitability.
That’s why real-time tracking matters: it smooths out these distortions and gives you live insight into what’s really happening.
Step 2: Identify Your Data Sources
Real-time COGS reporting relies on connected data. The key is to automate the flow of information wherever possible.
Core data sources include:
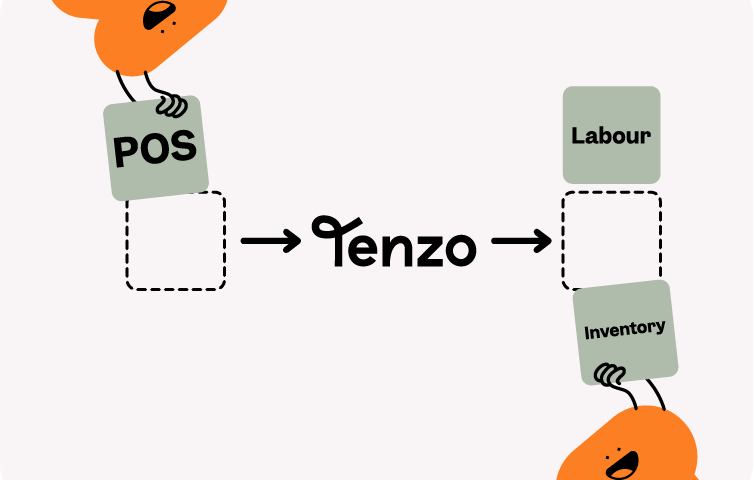
- Point of Sale (POS): Records what’s sold, when, and at what price. If integrated with recipes, it can also calculate the theoretical usage of each ingredient.
- Stock or Inventory Management System: Tracks what’s in store, what’s been used, and what’s been wasted or spoiled.
- Purchasing and Supplier Systems: Provide live information on costs, helping you track price fluctuations.
Example in practice:
Imagine your bar sells 50 gin and tonics in a night. The POS tells you the volume sold. If your recipe management system knows each drink uses 50ml of gin, it expects 2.5 litres to be consumed. If your stock system shows 3 litres missing, you know there’s overpouring, wastage, or shrinkage to investigate—right away, not three weeks later. To note, this all depends entirely on how often you do your stock counts, the more stock counts the greater accuracy.
Pro tip: To gain real-time visibility of COGS, use an aggregation tool that consolidates your data sources, automates calculations of theoretical usage and waste percentages, and tracks price fluctuations in one place. This allows your team to identify inefficiencies faster and drill down into the data to create customised reports on the metrics that matter most to your operation.
Step 3: Break It Down by Department
A single COGS percentage for the whole property is too broad to be useful. It won’t tell you whether rising costs are coming from the restaurant or the bar. Breaking it down by department gives you actionable insight.
Why it matters:
- The food lead sales may be performing perfectly, but the bar might be overspending on garnishes or premium spirits.
- The restaurant might be profitable, but banqueting may be experiencing high wastage from over-ordering.
By splitting COGS into categories, managers can take responsibility for their own area and make adjustments that directly impact results.
Step 4: Build a Real-Time Dashboard
Static spreadsheets quickly become outdated and are prone to errors. A dashboard is far more effective for real-time reporting because it automatically pulls in data, visualises it, and updates continuously.
Features of a strong dashboard:
- COGS % by department: A key metric, calculated as COGS ÷ Sales.
- Trend analysis: Daily, weekly, and monthly views so you can spot patterns and anomalies.
- Variance reporting: Compare actual performance against budget or forecast.
- Cost drivers: Highlight which products, categories, or suppliers are driving costs up or down.
- Visualisation tools: Bar charts for departmental comparison, line graphs for trends, and heatmaps for variance spotting.
Example:
If you notice your restaurant’s COGS % creeping from 28% to 32% over a two-week period, you can drill down and see it’s due to rising fish prices. You might decide to temporarily highlight alternative dishes, negotiate with suppliers, or adjust menu pricing to protect margins.
Step 5: Set Alerts and Thresholds
A real-time COGS report is only as valuable as the action it inspires. Simply displaying numbers won’t prevent overspending or wastage—your team needs automatic triggers that flag issues as they happen. This is where setting alerts and thresholds becomes essential.
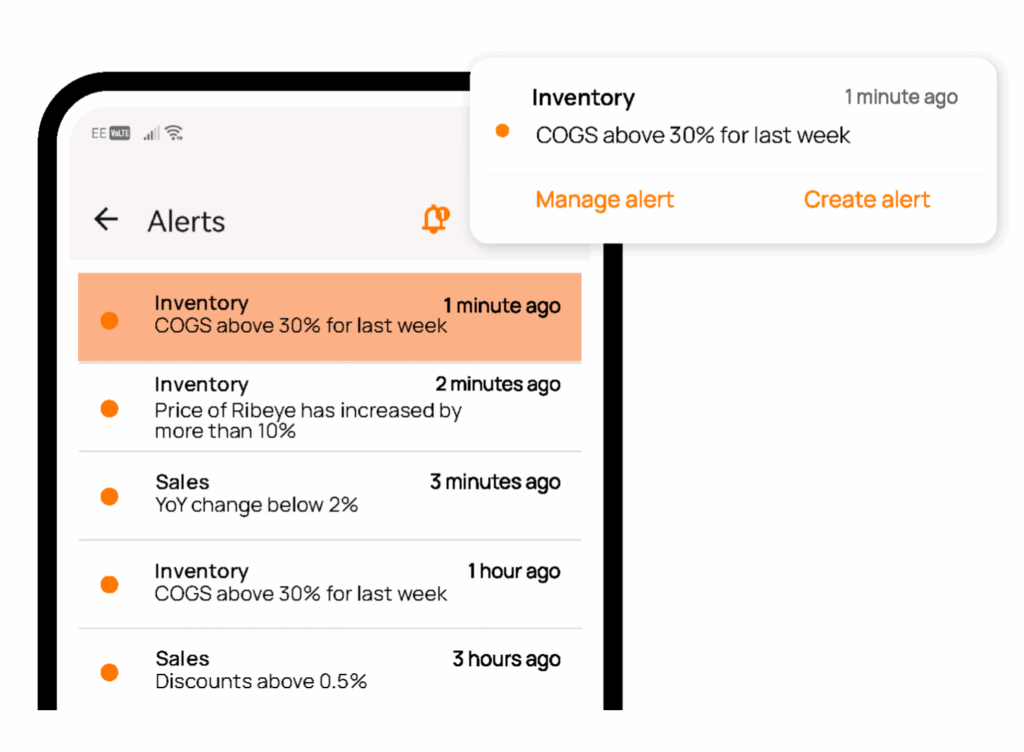
Examples of alerts include:
- If any department’s COGS % exceeds budget by more than 2% in a given day.
- If supplier prices for high-volume items (like chicken, coffee, or wine) increase suddenly.
- If waste recorded in a day exceeds 5% of stock used.
With these alerts, managers can act immediately—adjust orders, investigate waste, or even adapt pricing strategies—before the issue escalates.
Step 6: Make It a Daily Habit
The most sophisticated report is useless if no one looks at it. The final step is embedding COGS reporting into your daily routines.
Practical tips:
- Review COGS trends in daily stand-ups with department heads.
- Train managers to interpret dashboards so they understand what the numbers mean for their operation.
- Link COGS performance to departmental KPIs, bonuses, or recognition schemes to encourage accountability.
By making real-time COGS reporting part of the culture, you shift it from being a finance-only metric to an operational compass that guides decision-making across the business.
Final Thoughts
Hospitality operators don’t have the luxury of waiting weeks to find out whether they’re profitable. By the time a traditional end-of-month report arrives, the chance to correct overspending or reduce waste has already passed.
A real-time COGS trend report changes that. It transforms financial data into a live management tool, helping you:
- Spot rising costs before they erode margins
- Reduce waste and over-ordering
- Hold departments accountable for their performance
- React instantly to supplier changes and market conditions
In short, it keeps you in control. With the right systems, integrations, and processes, your COGS report becomes more than numbers on a page—it becomes the heartbeat of your operation.
Want Tenzo to help you create real-time COGS trend reports?
Tenzo is all about utilising your data, including COGS, to optimise your reporting and in turn your performance. Ready to get started? Request a demo and take the first step toward real-time COGS trends trends.
You may also like