The ultimate guide to restaurant data and analytics

In this article
- What is the data weâre talking about and how do you think about collecting that data?
- Your tech stack
- But the next question is, what to do with all that data?
- How do you bring all your data together?
- What is a data warehouse?
- Analytics and Business intelligence platforms
- A new way of doing things
- Finally, some analytics!
- Why should you use restaurant analytics?
- Visibility across the business
- Why is it important to get your team to engage with the data and how do you encourage that?
- What are the types of insights you can expect to gain?
Data is a hot topic in every industry. From banking to construction to farming, business leaders evangelise data and its powers. This reached its pinnacle when The Economist published an article titled, ‘The world’s most valuable resource is no longer oil, but data’ back in 2017. The phrase ‘data is the new oil’ became the new ‘it phrase’ (if ‘it phrases’ are a thing). The reason this topic came to the forefront was because the general population were coming to terms with the huge amount of data that tech firms were generating and how they could use that data in potentially nefarious ways. But what about restaurant data and analytics?
Something that was perhaps glazed over during those debates about how much data Facebook or Google have on each and every one of us is that data is used in absolutely every industry – it just so happens that the data those companies have is personal data on us. But that’s just one example of the type of data that can be collected. Data is also used in public health to fight diseases, in agriculture to save crops, in education and more with incredibly positive outcomes.
When it comes to the restaurant industry, we’ve been surprisingly slow to embrace data even though we generate huge amounts on a daily basis. In fact, according to BCG, in their 2018 digital maturity survey of top restaurant brands they found that ‘four in five brands can access a wealth of data from multiple sources, but only one in five has in place a comprehensive big data strategy, an integrated customer master data set that the entire organisation can access, or the ability to use predictive analytics algorithms to drive business decisions automatically.
Part of the reason for this is that restaurants have traditionally been businesses driven by gut-feel. Great managers and restaurateurs instinctively knew what worked and what didn’t. That strategy will have worked great in a world without the sophisticated technology we now have and when these restaurateurs could focus on a one or two location business. But, as restaurant businesses have grown, this is no longer as sustainable especially in an industry where margins are super tight.
Nowadays, though, we have accessto an absolute treasure trove of data from our point-of-sale systems, staff schedulers, inventory systems, loyalty programs, review platforms, reservation systems and more. The big question though is what to do with it all. That’s where restaurant analytics come in.
Data is nothing without a way to analyse it, but with dedicated analytics and business intelligence you can gain insights that, once actioned, can positively impact profitability of a business. And in an industry where the margins are so slim, that’s surely something we all want.
This blog will therefore be your ultimate guide to restaurant data and analytics.
We will cover:
- What we mean by restaurant data
- How to collect that data
- What to do with all your data (big data and data warehousing)
- What restaurant analytics are
- The importance of using restaurant analytics
- How to use analytics to extract insights
- Examples of said insights
In today’s digital world, all businesses are generating huge amounts of data, but it wasn’t until the pandemic that many restaurants realised just how much they had access to. As businesses became digitised and a vast majority of transactions were made online, more and more data became available.
But what do we mean by data? Data can sometimes sound like the be all and end all, but its definition is just a collection of facts or statistics to analyse. Any time something is logged, whether that be a sale, a review, a punch clock, it generates a data point that can give you more information.
When people think of restaurant data, sales data tends to be the first to come to mind. This includes how much money you’re taking in, of course, but also includes transactional data (how many transactions you’re making, the average size of those transactions, times of transaction, items per transaction and more), and product data (most popular products, most popular categories, best product by time period, etc) just to name a few.
And that’s not even considering streams of data outside of your point of sale, such as reviews, labour, and inventory data.
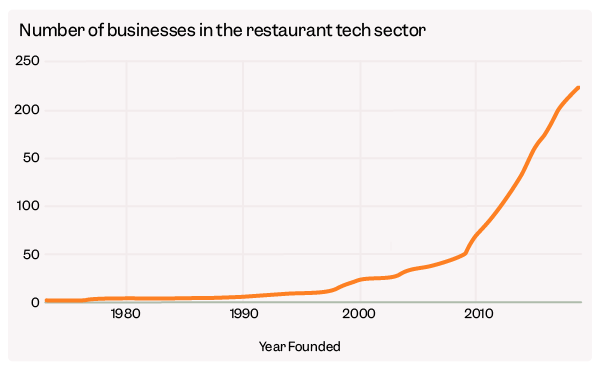
In fact, we’ve looked into it – over the last 10 years, the amount of potential data sources a restaurant can have has increased exponentially. Looking at the State of the Industry report for 2021 we saw that the number of restaurant tech companies in the last 10 years has been enormous. Looking at the top 226 businesses in the sector in the US, 78% were founded in the last decade, and all of these can be useful data sources.
What we’re trying to show here is that the amount of data you’re collecting from various sources without even realising is enormous no matter if you’re a small independent or a massive international chain.
What is the data we’re talking about and how do you think about collecting that data?
There are many different kinds of data streams that are important to a restaurant. You absolutely do not need to have all of them, but they do become more and more useful as your business grows.
 POS data. First up is your point-of-sale (your POS). POS data will gather all information about the sales you’ve made. If you have a modern, cloud-based POS system, then you can get very granular data such as those we mentioned above like transactional data, all the way to tip size, discounts added, order type and more. This enables you to deep dive into the details of each and every one of your sales and optimise them at every step.
 Labour data. The next thing to think about is your staff scheduling system. This is how you schedule your team, but also how you may communicate with them, set up their payroll, allow shift swapping and more – it alleviates the bottleneck of paper schedules when people are constantly unsure of what shifts they’ll be working from one week to the next. By scheduling this way, you’ll also be able to see the amount of labour scheduled at every hour of the day – a digital timesheet for your entire business.
 Inventory data. Inventory (or stock) systems keep track of all things stock so by connecting it to your POS and inputting all your recipes, you should know exactly how much of each ingredient is being used, what vendor it’s coming from and when it needs replenishing. You can use inventory data to keep track of wastage as well, helping you reduce the amount of food waste you generate.
Once you’re using all of these, you’ve hit the trifecta of systems that will allow you to have an overview of the three most critical elements of the operational side of your business. Having these data sources flowing into an analytics system will allow you to generate the most valuable reports for your business. More on this to come…
But before we look at analytics systems, there are even more data sources to consider.
Review data. Customer reviews from all different review sites are a great way to understand how good your service is and where it needs improving. But given the sheer number of different platforms it can be difficult to keep track. Gathering them all together allows you to compare reviews from different sites and see trends.
Customer data. You can then include customer data, such as the amount of times a customer might visit your restaurant, what they order, how large their transactions are and more. This can be done through loyalty programmes, reservation software, or a dedicated restaurant app depending on what type of business you run.
Delivery data. Knowing your most popular delivery platforms, what menu items are most popular per platform, as well as how quick delivery times are can give you information on which platforms to promote or where to offer deals.
Other sources of data. The above types of data are the ‘usual suspects’ of running a restaurant business, however you may also have custom data sources like footfall, wifi connections, or turnstyle data that would allow you to analyse trends. You could even benchmark against others in the same space as your business with competitor data like comparable pricing and reviews.
Your tech stack
No matter what kind of data you choose to collect, getting clean data is key and your tech stack is what’s going to provide that.
A tech stack is simply the systems you use in your business (all of the above). In order to get the data you need and to extract it, you will want to have cloud-based systems in place with open APIs.
Quick explanation of APIs: In layman’s terms, an API is simply a way to connect to a server. It will allow you to either ‘pull’ information from it or ‘push’ information to it. Here’s an article explaining the process behind it. For our intentions though, an API allows you to collect all the data from one of your systems (say your POS) and display it on another platform (again more to come on this…) It’s important that your system offers an open API that is published publicly so that you are actually able to pull that information, otherwise you’re pretty much stuck up a creek without a paddle and have no way to compare data sources.
But the next question is, what to do with all that data?
So now you have all these systems in place and they’re all generating their individual reports, but the real power comes when you can combine these to create insights.
Currently many businesses have all the systems in place, but no way to automatically connect them. This ends up creating issues as all your sales data is stuck in silos in your POS system, your labour data in your staff scheduler and your inventory data in your inventory system.
To access the data you end up having to go into each system and download reports individually and then manually input downloaded reports into spreadsheets in order to extract insight from your data. This process can be incredibly cumbersome, time consuming and prone to human error.
But why would you even want to extract that data in the first place if it’s so difficult?
As we’ve discussed, it’s often said that the answer is in the data, but all the data is a series of numbers that have no real meaning. What they really mean is that to improve your business, you need to be able to gain insight from that data. And that’s where analytics comes into play. By being able to compare data sources and see trends, you can make data-driven decisions for your business.
You see, it’s not really the data that’s that valuable, it’s how you interpret it and act on it that is. We like to explain it this way: Data -> Analysis -> Insight -> Action -> Profit. It’s a journey that begins with data and ends with profit, but there are still several steps in the middle. Unfortunately, we often see businesses not acting on their insights. It’s all well and good to see where performance is doing well and where it’s not, but you have to make changes to see results.
The main problem we see is that data and insights are often siloed within departments and aren’t shared with the right person at the right time and on the right device. Usually it’s one person or a team of people in the head office doing the analysis – but by the time those insights reach the general manager, who has the power to put those insights into action, the insights are out of date so are largely ignored. It’s so important to get these insights to the people actually working on the floor in near-real time.
But we’re getting ahead of ourselves here. The first thing to consider is how to bring all of your data into one place.
How do you bring all your data together?
Extracting data from each of your systems and putting it all together in an Excel spreadsheet might seem like the obvious step if you’re a small enterprise. It sounds pretty straightforward to begin with until you realise that downloading each individual report may take upwards of 20 minutes. And you may need to download a separate sales report for each day to compare to a separate labour report for the same time period. Suddenly a pretty simple task takes multiple hours to complete. Hours you could be using to act on the insights those reports give you rather than just compiling.
Really with all these new data sources available to you, you want to ingest data sources into a centralised data warehouse so that you can extract insights.
What is a data warehouse?
A data warehouse is pretty much what it sounds like. Basically, it’s a centralised storehouse for all your data streams (where they are connected by an API or uploaded by csv and entered manually) from which you can build reports, dashboards and more to extract insights. For a more in-depth explanation, check out what AWS has to say on the topic. Those reports and dashboards take a special type of system to create though. That’s where dedicated business intelligence (BI) systems come into play.
Analytics and Business intelligence platforms
It used to be that if you wanted to get business intelligence, you had to hire a data analyst who would set up one of ‘the big players’ in data analysis e.g. Power BI, Looker or Tableau. These can work well for big companies who have teams of analysts on hand, but the set up alone is time consuming and takes very specific skills. And once it is set up, only these analysts are able to use the programmes and the insights they gain need to be passed on to the team creating potential bottlenecks.
Furthermore, once you’ve set up one of these systems, the time and cost of it will prohibit you from changing your data source. Basically, every system has a different way of presenting data, so when you use Power BI or the like you load it into a database (or warehouse) as it comes and then build a dashboard on top of that. If you then want to change that system you have to start over from scratch. So that means if you decide that the systems you have in place are not for you, you face a huge cost to change them.
However, the advantages of these platforms are that they allow for very advanced data modelling and analysis. You can constantly experiment with different sets of data to see what will give you the best outcomes and you are able to manipulate your data in a huge variety of ways. This does require very specific skill sets though.
A new way of doing things
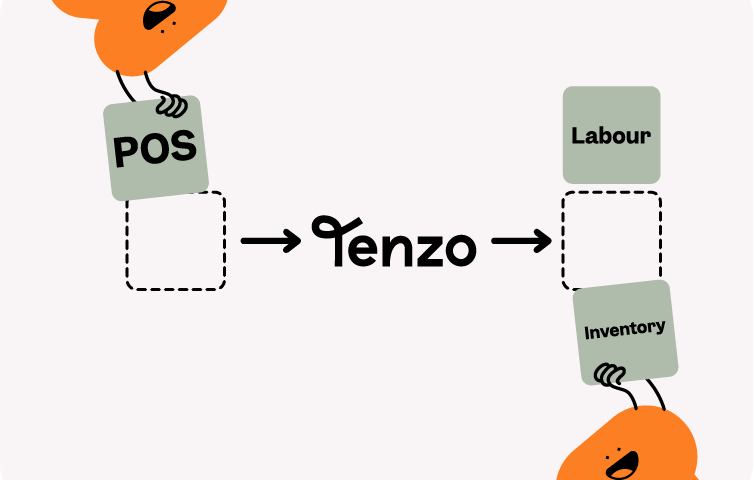
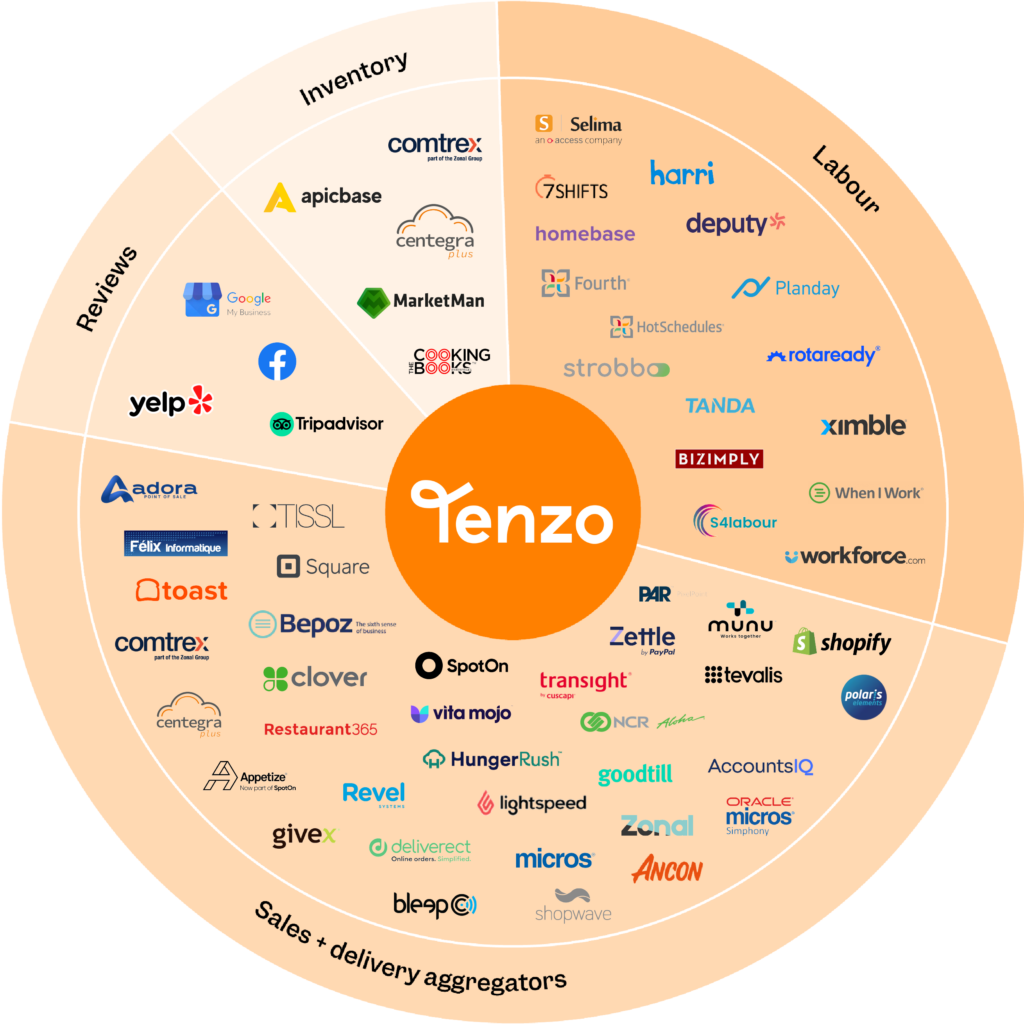
Back when those tools were the only ones available it meant that business intelligence was only available to large corporations who had the budgets for those set ups. But now we’ve democratised that data by creating purpose built business intelligence and reporting platforms for any size of restaurant. Platforms like Tenzo.
The way we extract data at Tenzo involves unifying the schema for all of our data sources (our integrations). That means that no matter the system we normalise their data into one single view that allows us to treat them all equally.
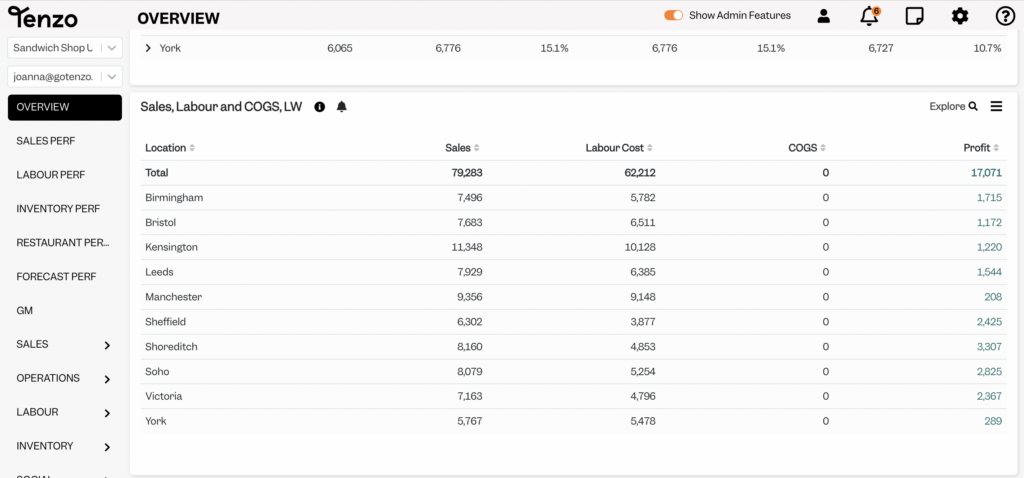
This allows us to show the same insights no matter what systems you have in place and enables us to give you access to the insights we know are most valuable. Crucially, for large businesses with multiple POS, labour and inventory tools, we can present the data from each in the same reports so that all your POS data, for example, is available to you in one dashboard as opposed to a dashboard per system. As an added bonus, we can also forecast your future sales. When you’re using the same schema, we can use our AI forecasting tech on top of it to predict your sales.
So it’s this unified schema which enables the amazing insights we’re able to provide.
Finally, some analytics!
One you’ve brought all your data together, you’re able to see trends. Mapping the data trends over time and comparing them to other data will give you insights to your business that may never have crossed your mind.
Being able to see certain metrics side-by-side is the best part of business intelligence platforms. You can access these as reports quickly and easily so you can dig into why something may be occurring.
This is best illustrated with an example:
Say you notice a drop in sales at one of your cafes on a Tuesday morning, but you don’t understand why Tuesday is the only morning where they drop. So, you decide to look into this more carefully – you see that the sales drop is only in one category: sandwiches, and when you drill down even further, you see that it’s your pre-made sandwiches which are not selling as well. If it’s only the pre-made ones, you think to yourself, maybe your team hasn’t had enough time to prep everything.
So, you look at the amount of labour hours scheduled, but it seems like it’s the same as any other morning, so you drill down into the number of hours scheduled by house part (eg front or back of house) and see a discrepancy. When you look at it by role you notice you actually have an extra barista on hand and not a prep chef: the one chef that is there is not able to prepare as many sandwiches as they can when there are 2 prep chefs and customers are discouraged by empty display cases.
The solution is clear, swap out the extra barista for another prep chef and you immediately see a rise in sales. A perfect example of Data -> Analysis -> Insight -> Action -> Profit.
Without all those metrics (total sales, sales by category, sales by item, labour hours scheduled, labour hours by house part), you wouldn’t see the anomalies and you might assume that something totally different is causing the loss in revenue.
That’s where analytics allow you to make the correct changes to increase profit.
Why should you use restaurant analytics?
There are quite literally thousands of examples like the one above and while some of these can be deduced by gut instinct alone, many others can’t.
The fact is, in such a slim margined business as the restaurant industry, analytics allow you to make changes that will actively boost your profit.
But it’s not just about profit: these analytics give you a complete overview of your business. This is extremely useful for your team as everyone has a single source of truth and transparency no matter what department they work in (e.g. operations, finance, IT, etc) and can benchmark accurately and drive faster decision-making (a must in today’s fast-paced world).
Visibility across the business
When you start to combine all your sources of data, you get a better understanding and increased visibility over the business. For example, when you track customer and review data, you understand social sentiment at all times. The benefits of alerting your managers or team members on the floor to negative reviews as soon as they come in can help alleviate issues as soon as they happen.
You’ll also be able to keep an eye on your different channels, and how much revenue is coming in from delivery, takeaway, and eat in.
In today’s world, diversified channels are no longer just a token add-on – whether it’s delivery, kerbside pickup, takeaway or anything other than traditional eat-in these channels need to be treated just as seriously, but have different requirements.
For example, the better you understand your delivery demand, the more you can optimise your menu to be as deliverable as possible so that it can withstand being in a container for up to 30 minutes on the back of a motorcycle. You’ll also know how to staff your restaurant so you can tackle deliveries as well as eat in, operating in sections to make everything run as smoothly as possible.
Finally, as you grow your business to multiple locations, you can think about benchmarking. You want to find out which location is performing best and where some help is needed and to do that you will need comparable metrics like average transaction size or attachment percentages of sides or desserts. When you can compare in this way, you get instant access to benchmarking that can help you achieve success more quickly.
Why is it important to get your team to engage with the data and how do you encourage that?
Remember how we mentioned that data can get siloed within departments and not reach decision makers in time? This is often where we see businesses run into issues. They’ve set up a business intelligence platform, but no one but the analysts know how to use it. This means that the operations team has to wait for insights to be passed on to them from analysts and by the time they receive them, they’re out of date.
That’s why it’s so important to implement a system that is comprehensible to everyone in the business and why getting real-time data insights can make decision making a lot more proactive. Not only will your team have the tools to do their jobs in the best way possible, but it will create more engagement across the business.
Of course, different people need different information. The insights that are most valuable to the team in Head Office will not be the same as those that are most valuable to your general managers. Head office needs an overview of the entire business, whereas the GM will want information about their venue specifically. It’s also important to remember that sometimes less is more. We don’t want to drown GMs in data when they only need a few KPIs to keep track of.
In order to get the teams across the board to engage with these insights, they need to be delivered in the best way possible. For corporate teams, this will most likely be on a desktop, but for operations managers or general managers working on the floor, mobile will be far more engaging to them, as they’re constantly on the move and don’t really have time to sit behind a desk to look at reports.
It’s also important that these insights arrive in near-real time. It’s no good getting a team to engage with data that is now out of date. Getting the most up-to-date data from your systems means that you’ll be able to tackle issues before they become problems.
But when you have near-real time insights, you also want to be alerted on the go – being able to receive automated emails every morning telling you exactly what performance was like yesterday is extremely helpful and keeps everyone up to date. Ditto with alerts – when you know if you’re going to be understaffed ahead of time, you can rectify the situation before customers have to deal with long waiting times.
The more your team is able to engage with data and insights, the more actions can be taken to improve the efficiency of the business.
What are the types of insights you can expect to gain?
One you’ve connected all your systems and have an analytics set up you can expect to have access to unique and invaluable insights and reporting.
The magic number
When you combine all your data sources you can easily generate flash P&Ls on the go. This means that you’ll always be up to date and aware of exactly how well your business is doing. No more surprises at the end of the month.
Sales insights
Tracking key KPIs over time is a great way to be able to see how your business is doing – and that can be any amount of time. Comparing what your sales look like vs last week, last month, last year, or even two years ago (if last year was a write-off in the case of a pandemic for example) can give you a rolling idea of seasonal trends and can enable realistic targets.
Talking of targets, being able to track sales vs targets (or budgets as we call them) broken down over time is key. That means that if you have yearly targets, you can break them down by month and by week while also factoring sales patterns so you wouldn’t have the same target for the first week of summer vs the third week in November.
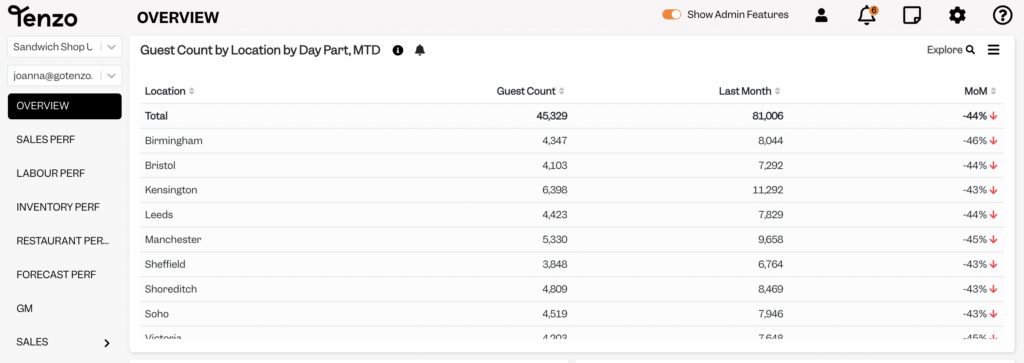
Also keep an eye on guest counts, a drop off in this can signal that there are other mitigating circumstances (e.g. a closed station or road blockage) that you need to be aware of. Tied to guest count, average revenue per group size can also be extremely useful to gauge future sales based on reservation data as well as helping you figure out the most profitable table layout plan.
Menu insights
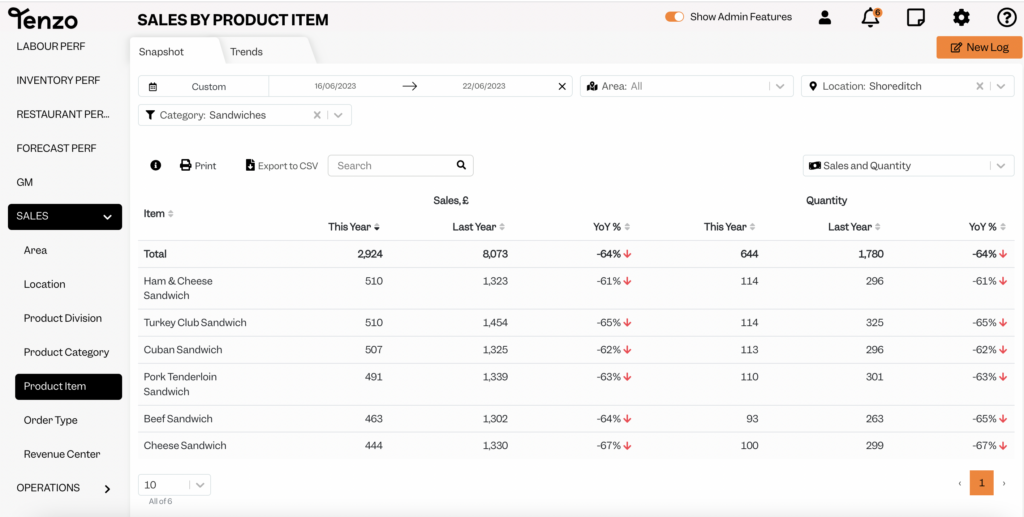
Knowing what’s working and what’s not on your menu is key. Figuring out your stars, cash cows, dogs and question marks (check out Marketman’s ebook, The 6 Laws of a Resilient Restaurant to find out more about these) is a great way to optimise your menu. Use metrics such as Top 10 sales by Division, Category, and Item and attachment of each of your product items (the number of times something is included on a transaction/receipt) to make your menus as efficient as possible.
Channel insights
Delivery and take-away sales have become more of a staple in the sales mix for many businesses since Covid so tracking when channel mix by hour can help you staff and prep as efficiently as possible.
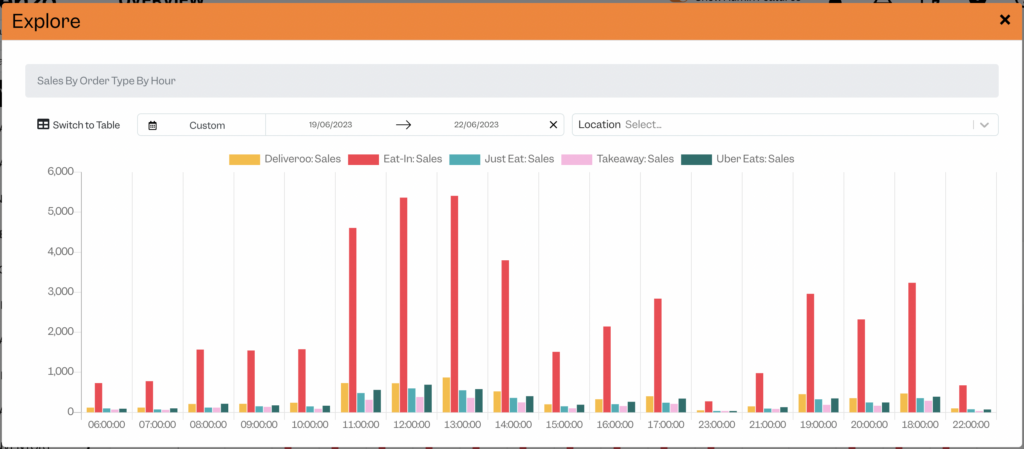
Plus, when reviewing trends in your sales performance, looking at the average transaction value (ATV) can be super insightful. It will help you understand your sales channel performance – for example Deliveroo v. Ubereats v. direct takeaway sales – and through which channels your customers are spending the most money. As an outcome of this analysis you’ll identify opportunities to fine tune your menus and promotional offers to improve channel performance.
Employee insights
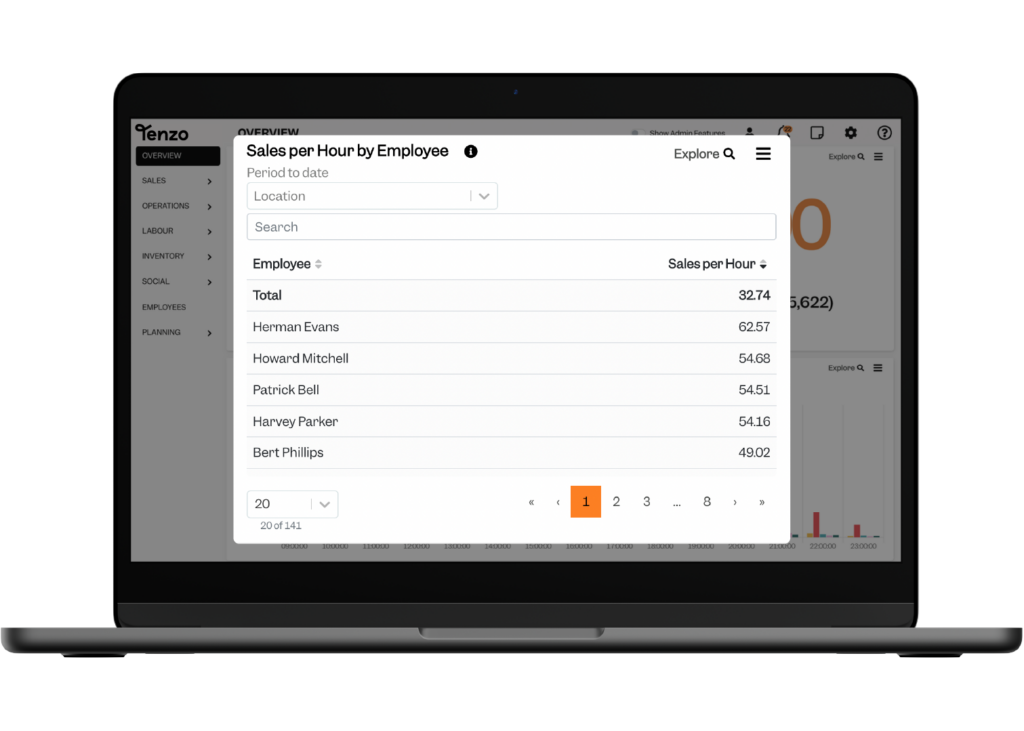
When your team logs on to a till to ring up a purchase, you can see which team members have the highest average transaction values (for the time they work, comparing a Tuesday morning to a Saturday evening is not exactly a fair comparison) which allows you to see who is your best upseller on the team. They can then share their tips and tricks with their colleagues so that everyone is able to upsell to the same level.
Labour insights
The real magic comes from when you combine data sources (as we’ve been harping on about through this whole blog). So when you can see your cost of labour as a percentage of your sales you will always know exactly where you stand. By breaking it down even further and looking at this cost of labour as a percentage of sales by hour you can also start to consider how to maximise revenue across the hours when the cost of labour as a percentage of your sales is higher.
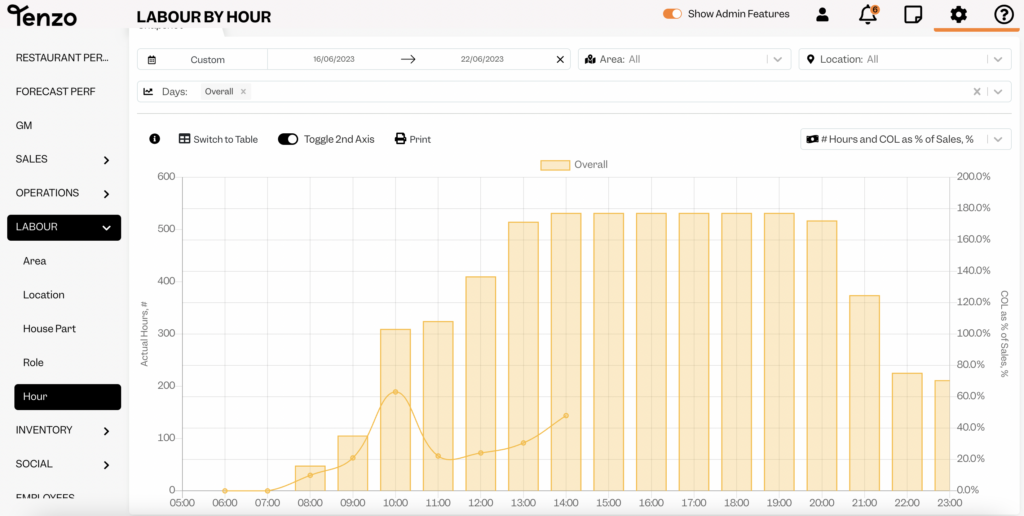
Flip that on its head and look at labour productivity as well. Labour productivity amounts to how many sales you’ve made per labour hour scheduled and allows you to see what hours of the day are bringing in the most revenue and where you could stand to make your rota more efficient.
You may also like