What sales metrics are other hospitality operators tracking to improve their performance?

In today’s competitive hospitality landscape, success isn’t just about offering excellent service—it’s about measuring the right things to improve continuously. Operators are increasingly leaning on data-driven insights to refine guest experiences, boost revenue, and streamline operations. But with so many potential numbers to track, the real question is: which metrics matter most?
We recently held in-person and virtual workshops where we created popular sales metrics used by operators using our Card Creator feature.These are the KPIs operators are monitoring to drive performance.
1. Delivery Channel Commission Card
The first card we created analysed sales based on order type, with the delivery channels segmented further by commissions paid to gain a more comprehensive understanding of sales performance.
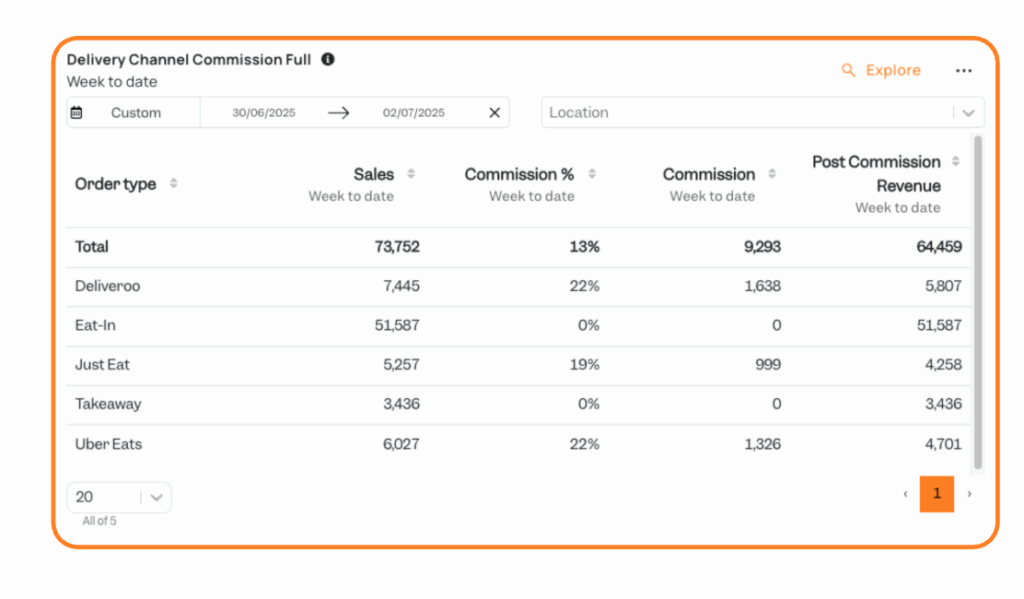
By breaking sales down this way, operators can identify which channels are most profitable, which may have higher costs or lower margins (such as third-party delivery), and where to focus marketing or operational improvements.
For example, strong dine-in sales might highlight the value of atmosphere and service. At the same time, growing delivery orders could signal the need for better packaging, faster fulfilment, or renegotiating commission fees.
Ultimately, this insight enables operators to balance resources, tailor strategies to each order type, and make more informed decisions that drive both customer satisfaction and profitability.
2. Hourly Covers vs Theoretical Max Capacity
Next, we compared the number of guests served in an hour to the available capacity, represented in bar form, and the theoretical capacity shown as a straight line to help visualise hourly cover productivity.
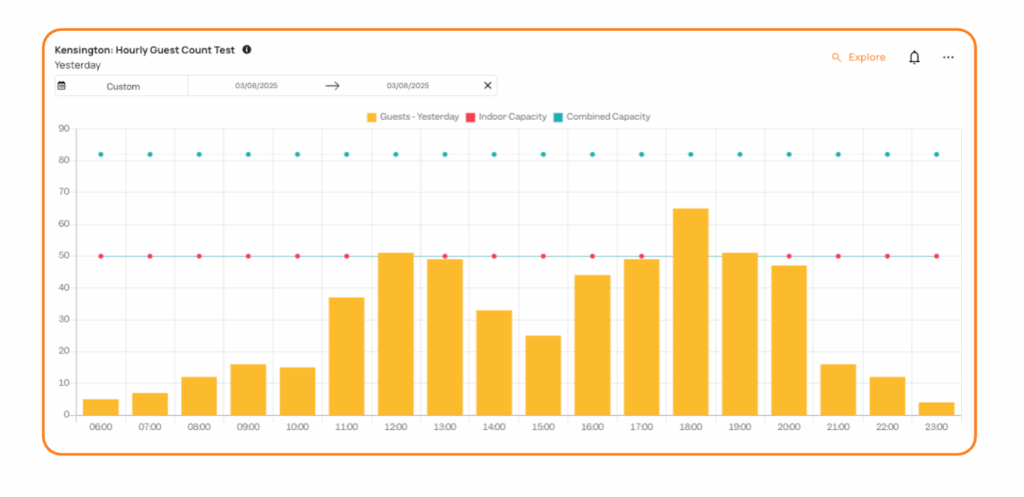
Operators track hourly covers against theoretical maximum capacity to understand how efficiently they are using their available space and resources. This comparison assesses whether a venue is maximising its potential during peak times or leaving revenue on the table due to gaps in seating, service flow, or reservation management.
If actual covers consistently fall well below capacity, it may indicate missed marketing opportunities, staffing inefficiencies, or issues with table turnover.
On the other hand, consistently hitting or exceeding theoretical capacity could signal strong demand, but also potential strain on staff and a compromised guest experience. By monitoring this metric, operators can optimise scheduling, adjust service models, and develop strategies to maximise revenue while maintaining a high-quality guest experience.
3. Sales vs Budget / Forecast by Location
In this report, we are examining sales performance against budget. What makes this card more interesting is the forecasting metric, which compares the forecasting accuracy of head office forecasts against the general managers to improve overall forecasting accuracy.
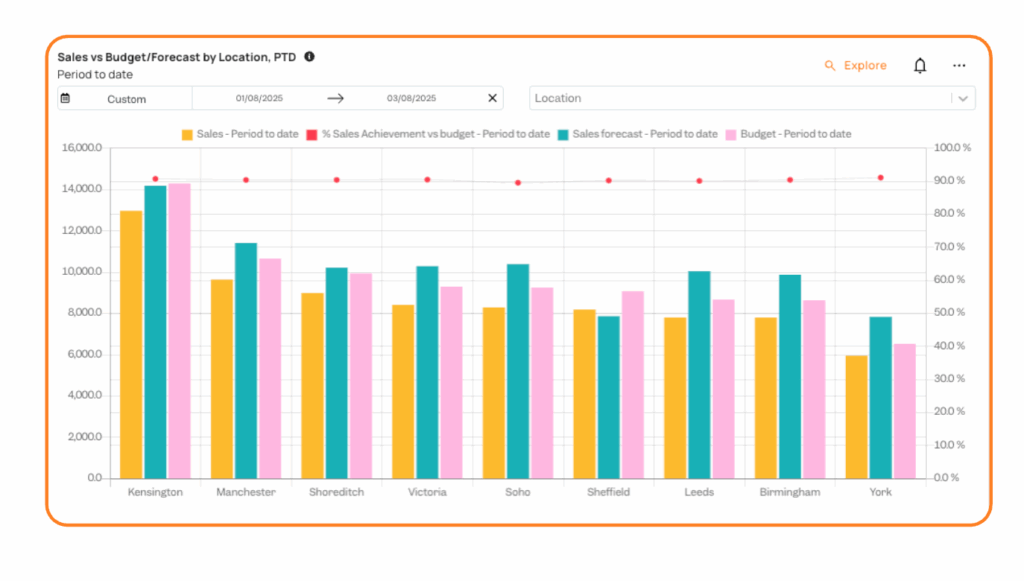
This card enables financial discipline and accountability across the business. Comparing actual sales against the budget helps operators quickly determine whether performance is on track, ahead, or falling short.
Meanwhile, measuring forecast accuracy highlights how well managers can predict demand and allocate resources effectively. Accurate forecasting is critical for controlling labour costs, managing inventory, and planning promotions, and it also builds confidence in decision-making at every level of the organisation.
By holding both the head office and managers accountable for budget adherence and forecast reliability, operators can identify gaps in strategy, enhance communication between teams, and drive more consistent and profitable performance across their portfolio.
4. Sales by Category by Day Part
Finally, we compared sales performance between custom periods, broken down by category and day part, to understand what’s contributing to growth in sales or limiting performance.
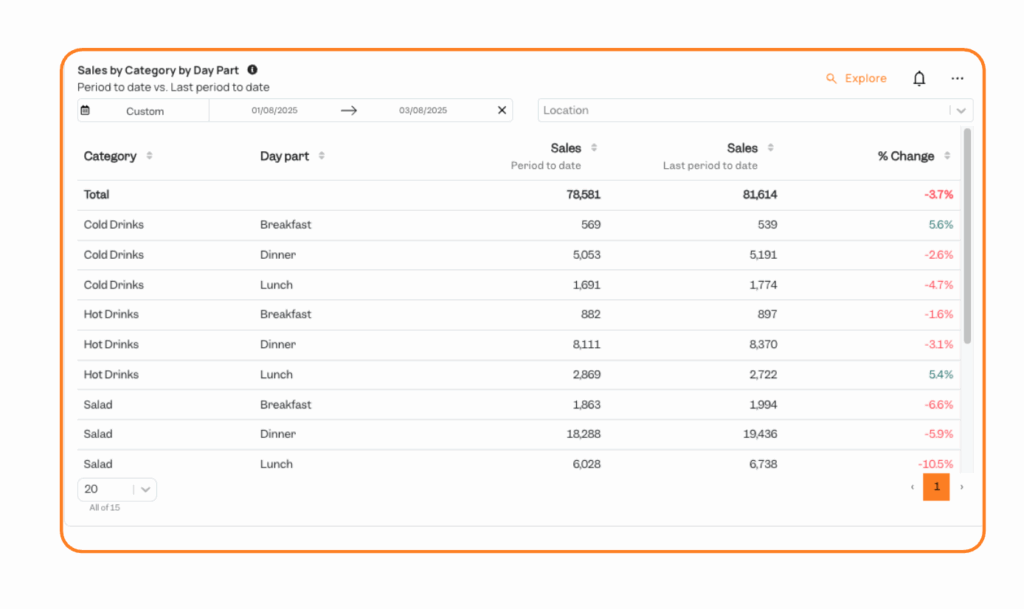
Hospitality operators track Sales by Category by Day Part to understand not just what is selling, but when it’s selling. Breaking down categories such as food, beverage, or specials across breakfast, lunch, dinner, and late-night gives operators a clearer view of guest preferences and revenue drivers throughout the day.
This insight helps with everything from menu engineering and pricing strategies to staffing and stock planning—for example, identifying which cocktails perform best in the evening or whether lunch mains are underperforming compared to dinner.
By aligning offerings with demand by day part, operators can maximise profitability, reduce waste, and create targeted promotions that boost sales during slower periods while capitalising on peak times.
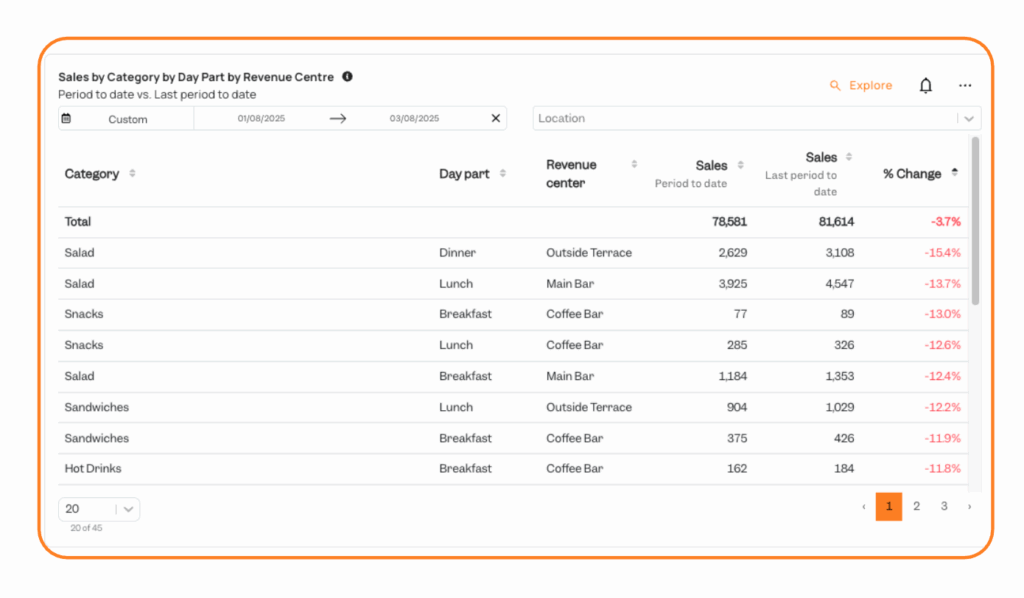
In Tenzo, you can always further edit the reports you create to ensure your metrics reflect your needs with Card Creator. In this case, we added a revenue centre to further segment your data by analysing their most profitable outlets, spot underperforming areas, and make informed decisions on where to focus investment or improvements.
Want to create these reports with a few clicks?
Tenzo is all about creating the right reports that will drive performance. Ready to get started? Request a demo and take the first step toward smarter operations!
You may also like