How to Create a Monthly Hotel F&B Performance Report: A Complete Guide

In the hotel business, the Food & Beverage (F&B) department is often more than just a source of revenue—it’s a core part of the guest experience. From breakfast buffets to rooftop cocktails, F&B can be a major profit center… or a hidden drain on resources if not monitored closely.
That’s why a monthly F&B performance report is essential. It gives you the data you need to understand how your restaurants, bars, banquets, and room service are performing, so you can maximise profits while maintaining quality.
In this guide, we’ll break down what to track and how to segment the data so your team can make better decisions.
Why an F&B Performance Report Matters
Unlike room sales, F&B revenue has many moving parts—menus, inventory, labour, and guest satisfaction all affect the bottom line.
A monthly report helps you:
- Identify your most and least profitable outlets.
- Track cost control and prevent wastage.
- Optimise staffing and scheduling.
- Align menu pricing with market demand.
- Understand guest feedback and improve service.
In short, it transforms raw sales and cost data into actionable insights that help maintain quality, improve efficiency, and boost the bottom line.
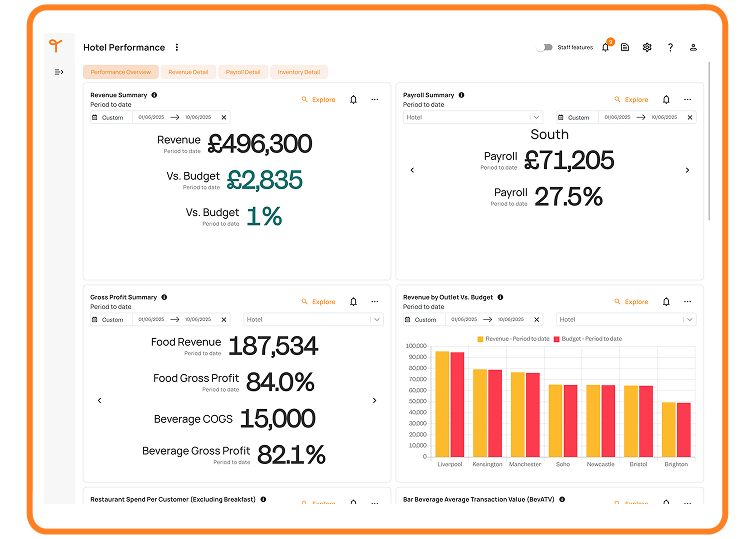
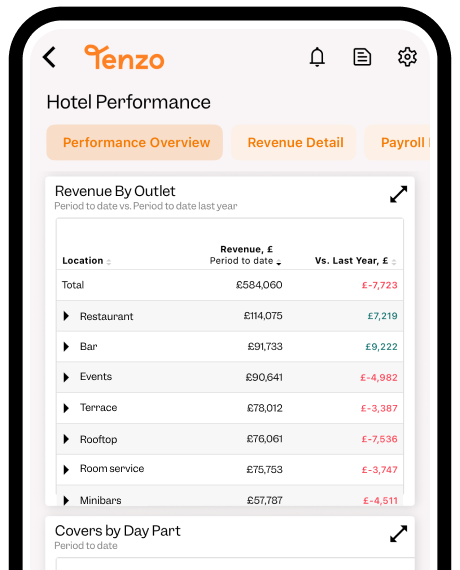
Breakdown Performance by Revenue Centres
Tracking performance through revenue centers reveals the strengths and weaknesses of each individual business unit rather than treating the hotel as a single revenue stream.
Hotels F&B outlets typically generate income from multiple sources including:
- Restaurants, at times having multiple throughout the property and varying from indoor and outdoor dining.
- Bars / Cafe
- Room service
- Mini bar
- Conference and events catering
Each has different cost structures, demand patterns, and profit margins. By reporting them separately, managers can see which areas are exceeding expectations, which need operational adjustments, and where resources or marketing efforts should be focused.
This granular view also prevents profitable departments from masking the underperformance of others, enabling more accurate budgeting, targeted decision-making, and ultimately stronger overall financial health.
Segment the data further based on Breakfast, Lunch and Dinner
Similar to breaking down performance by revenue centres, monitoring data through day part is designed to create a report that reflects the costs of each day part.
The key outlier in this case is Breakfast.
Breakfast often caters primarily to in-house guests and may be included in room rates, making it a volume-driven service with tight cost control needs. Additionally, instances where breakfast is not included, it’s expected that spend per head will be lower than lunch and dinner, alongside labour where a more catering style approach is often the norm in hotels.
Lunch typically attracts a mix of business and local clientele, requiring a balance between quick service and quality to maximise table turnover. Dinner, on the other hand, is usually higher-margin, more experience-focused, and influenced by upselling opportunities such as premium beverages or multi-course menus.
By analysing these periods separately, hotels can identify which meal services are most profitable, adjust staffing and purchasing to match demand, design targeted promotions, and refine menus to improve both guest satisfaction and revenue for each distinct service window.
Metrics to Track
1.Volume Metrics
Hotel F&B outlets have different volume metric needs depending on their type.
ATV
Bars and cafes should be viewed through an average transaction value (ATV) lens as it measures the average value of each transaction—regardless of how many people that transaction covers. It’s calculated by dividing total revenue by the total number of transactions. This makes ATV especially useful for bars, cafés, and retail outlets where guests may purchase items individually or in small groups.
SPH
In turn, restaurants and events should be tracked through Spend Per Head (SPH) as it measures the average revenue generated per individual guest. It’s calculated by dividing total revenue by the number of covers (people served). This metric is most relevant for restaurants, banquets, and events where pricing and profitability depend on what each guest spends, not just the total bill.
In short: ATV focuses on the value per sale, while SPH focuses on the value per person—two perspectives that can lead to different operational and marketing strategies.
2.Utilisation Rate
Hotels need to use their space as effectively as possible – there’s countless options available to utilise different areas of the hotels, thus it’s important to ensure what’s on offer is driving the highest profit margins possible.
Tracking performance by square metre for F&B measures how much revenue each area of dining space is generating, allowing managers to assess the true efficiency and profitability of their floor space. This metric helps identify which areas deliver the best return on space and which may be underperforming.
By understanding revenue per square metre, hotels can make informed decisions about layout changes, seating density, seasonal adjustments, or even repurposing low-yield areas to more profitable uses, ultimately maximising both space utilisation and overall F&B profitability.
In-House Guests vs Local Guests
Tracking in-house guests versus local guests reveals the balance between captive demand from staying guests and additional revenue generated from the local market. In-house guests often drive predictable baseline sales, such as breakfast or room service, while local guests can boost revenue during off-peak periods and help fill restaurants, bars, or event spaces beyond the hotel’s accommodation capacity.
Understanding this split allows managers to tailor marketing, promotions, and menu offerings to each segment, optimise staffing for different service patterns, and assess the effectiveness of outreach efforts aimed at attracting non-resident customers. Ultimately, this metric helps hotels diversify their F&B revenue streams and reduce reliance on a single customer base.
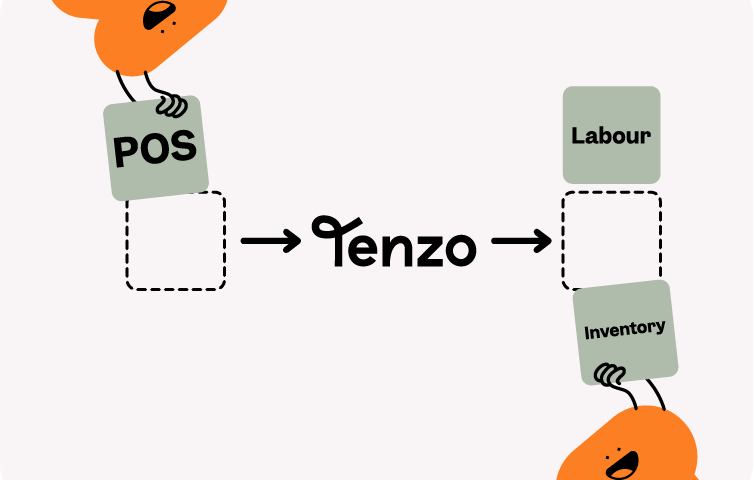
Want Tenzo to help you create monthly hotel performance reports?
Tenzo is all about creating the right reports that will drive performance. Ready to get started? Request a demo and take the first step toward smarter operations!
You may also like