Leaderboards: A Data Driven Approach to Increasing Restaurant Sales
There are a number of strategies to increase your restaurant sales such as the use of loyalty programs, delivery, online ordering etc. However, this article focuses on one key lever that tends to get less attention: employee performance.
Leaderboards, alongside competitions, bonuses and compensation plans, are an effective way to drive sales. Typically, we find them used for:
- Increasing speed of service in Quick Service
- Driving up-sell and average check size
- Selling specific items (“attachment”) e.g., fries and a drink
- Improving social media performance (higher review ratings drive more revenue)
Furthermore, they also help reinforce positive behaviours, boost morale and increase transparency throughout the business.
Here are some example leaderboards you could consider using:
- Average Transaction Size
- Average Sales per Hour
- Individual Product Sales
- Social Media Reviews
- Individual Location Sales
1) Transaction Size Leaderboard
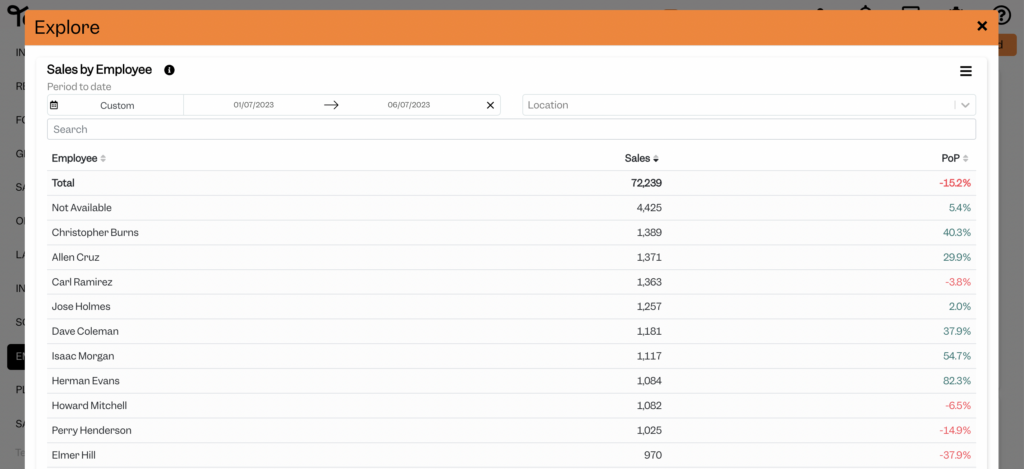
A transaction size leaderboard ranks employee performance by how far above or below the individual employee’s average transaction size is compared to the average transaction size of the whole team in the same period worked. For example, Patricia Johnson is the clear winner with an average transaction size of 540% above the average transaction size of her peers in the same time period. The reason this comparison is important is that you might have people who work specific days, or specific shifts, have a higher check size just because of the time of their shift (i.e. Saturday dinner may always win)
2) Average Sales per Hour Leaderboard
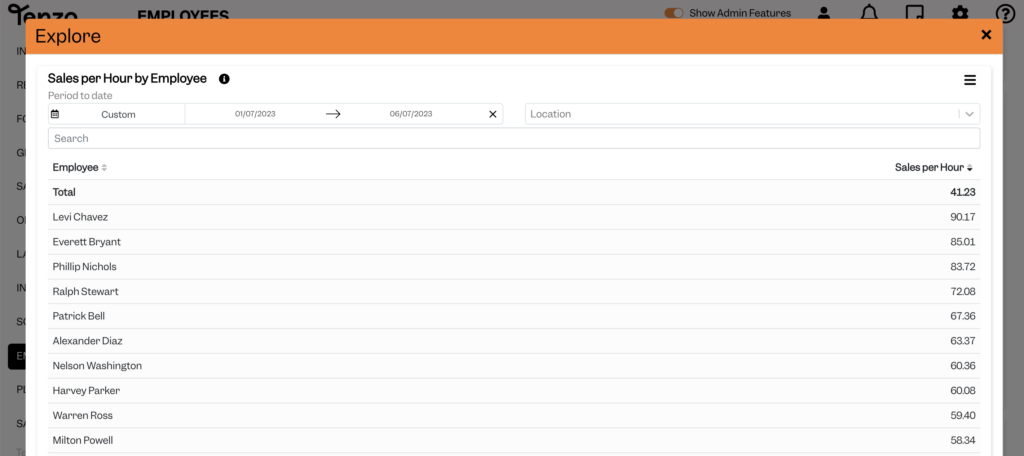
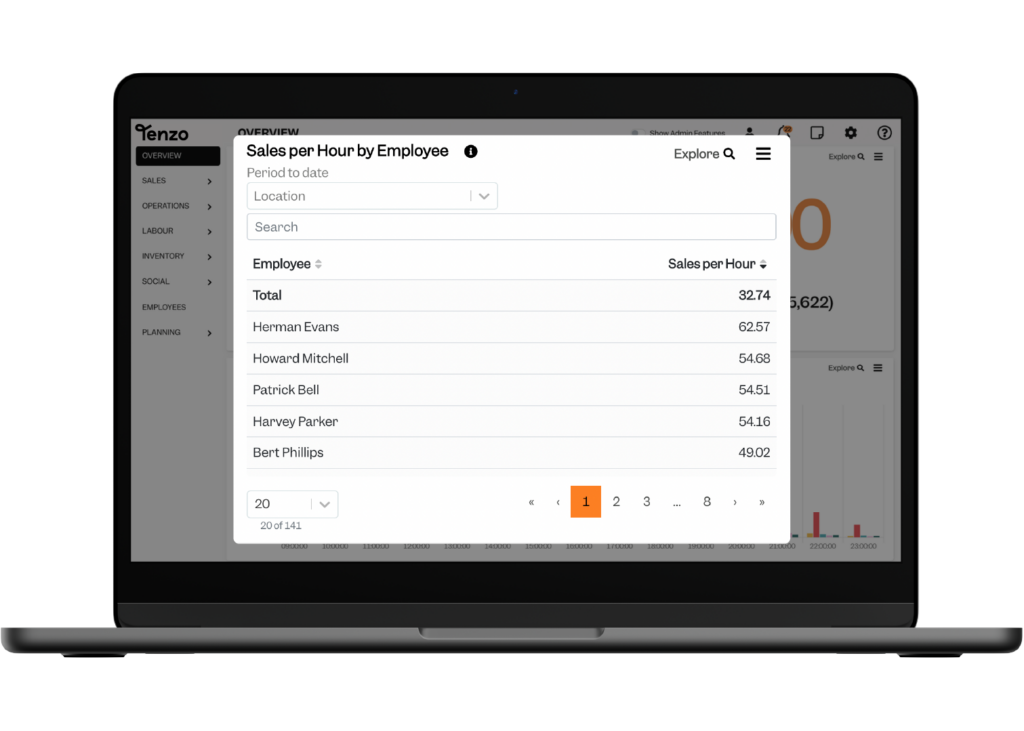
The average sale per hour leaderboard ranks employee performance by how far above or below the individual employee’s average sale per hour is compared to the average sale per hour of the whole team in the same period worked. For example, Patricia Jones is the clear winner with an average sale per hour of 218% above the average sale per hour of her peers in the same time period (Friday evenings with Friday evenings etc).
3) Product Sales Leaderboard
Ranking employees based off total sales of individual product items is particularly useful for selling off any food quickly (e.g. chicken) or encouraging promotional sales (e.g. specials/limited time only products). In our example, John Smith sold off the most chicken salad (126 sales) in the last three days of May.
You can imagine doing the same thing to up-sell a small item (e.g., breadsticks, cookies), or supersize a meal.
4) Reviews Leaderboard
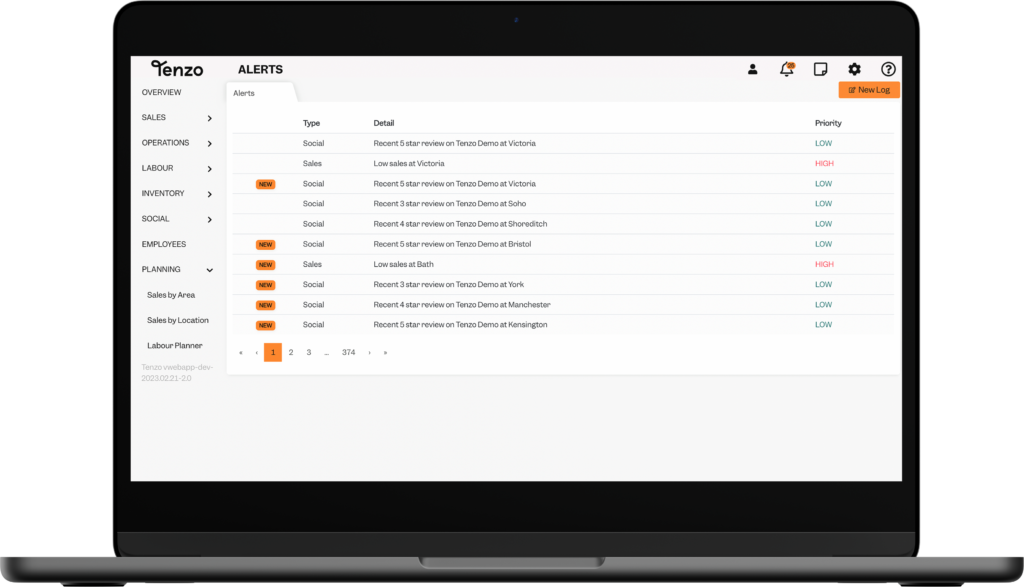
Reviews leaderboard promotes a sense of teamwork within the individual stores by ranking the locations by average social review rating over any given period. It can also be helpful to understand whether each location is trending up or down compared to the period prior. For example, the Kensington location has the highest rating for the month of May and is trending up compared to April.
5) Location Sales Leaderboard
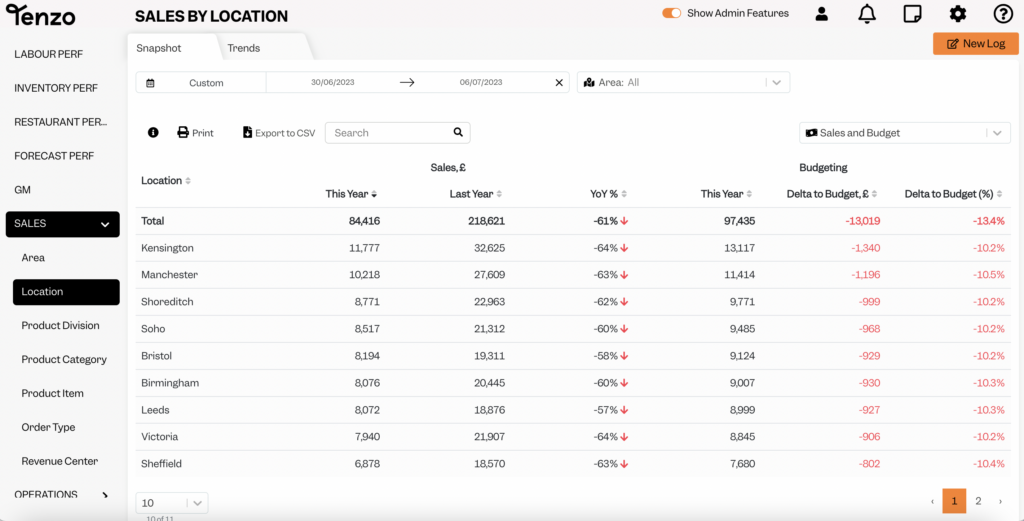
The location sales leaderboard is another means to promote a sense of competition between the different stores. In this leaderboard, we rank the locations by sales as a percentage of the total sales for the chain. In this example, Kensington is the winner for the month of May as it has increased its YoY% change by 200% from 4.2% to 12.2%.
